This iteration of the RedMonk Programming Language Rankings is brought to you by MongoDB. From the edge to the cloud, MongoDB enables you to work with data as code – in any language – so you can build and ship applications faster. If you are a Python, .NET, Java, or Javascript developer, get started now with MongoDB University.
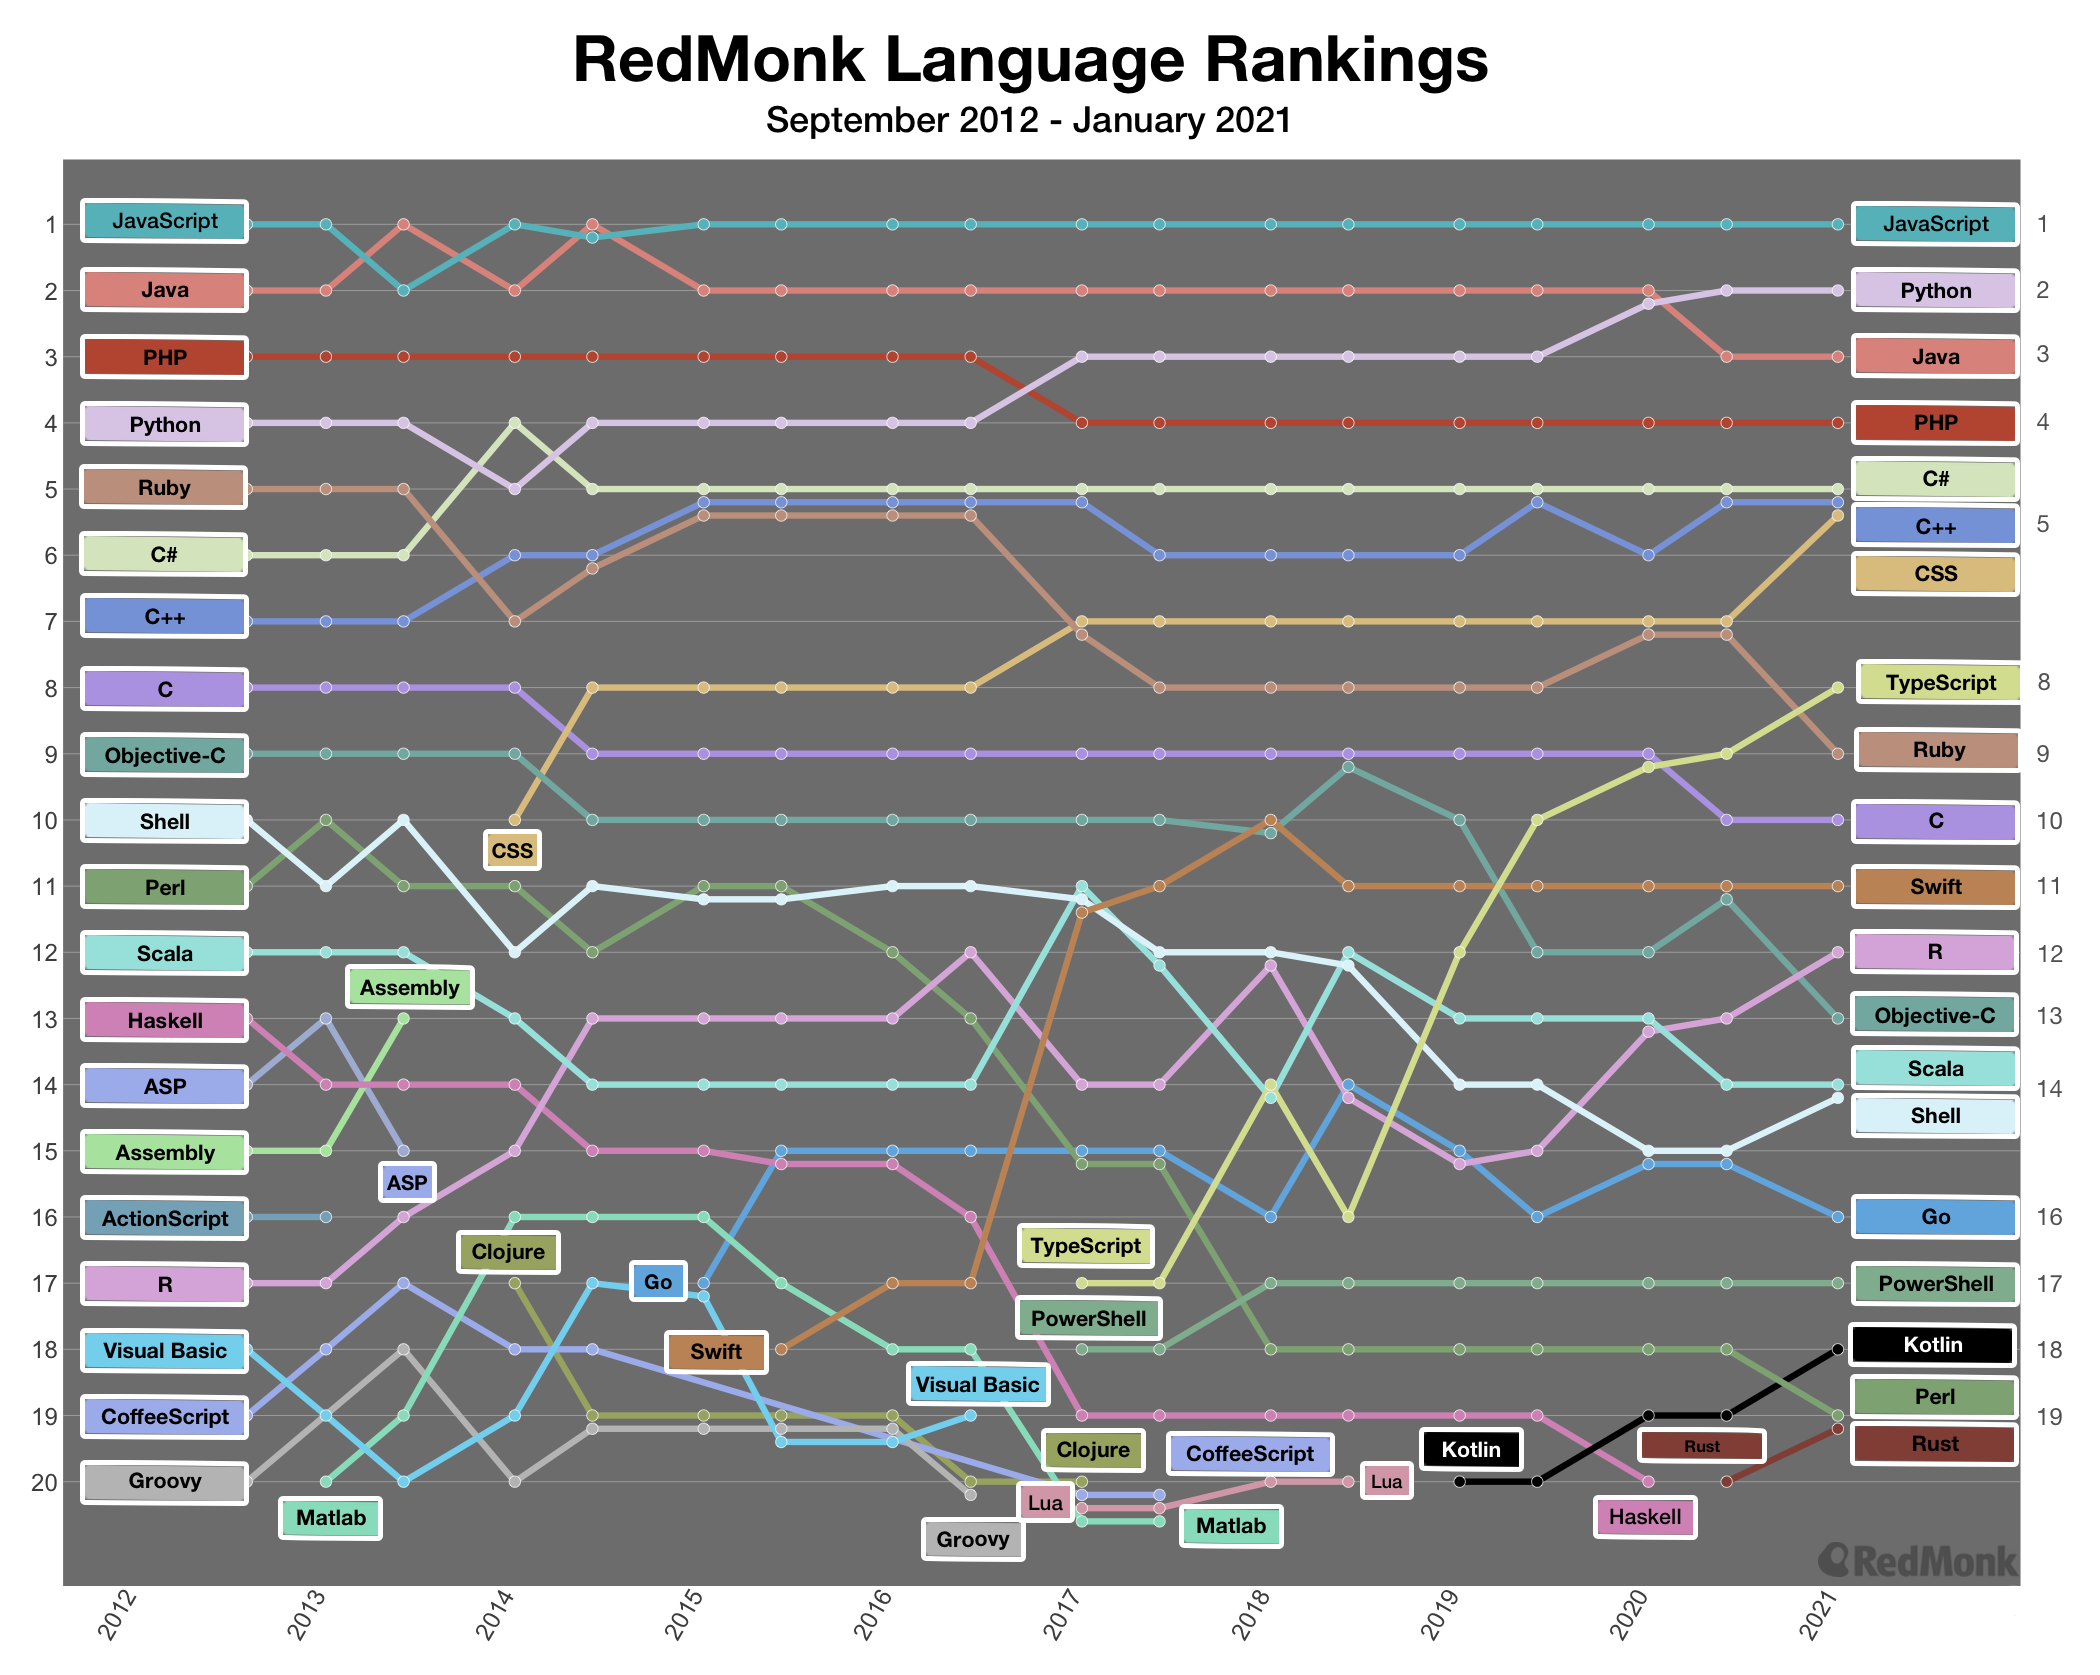
As part of RedMonk’s latest analysis about programming language rankings, here’s a visualization that tracks the movement of the top 20 languages over the history of the rankings:
Interpreting the Chart
You can track a specific language’s ranking over time by following the horizontal progression of the language’s rank over time. While the 2012 rankings reflect September of that year, subsequent rankings at a given year are for January of that year, with the rankings that immediately follow reflecting June of that year (e.g., “2013” corresponds to January 2013, and the iteration immediately to its right corresponds to June 2013).
You can review the Top 20 languages of any given iteration by running through the respective data points vertically from top to bottom. Any time that points are clustered, that means there was a tie and multiple languages share the rank.
If a language was previously on the chart but is no longer visible, it means the language is no longer in the RedMonk Top 20. (While they are no longer included in this specific visualization, rest assured they are still active and vibrant communities.)
Languages that break into the RedMonk Top 20 are seen as new entrants to the chart. (Just like the languages that drop off the top 20, these didn’t ascend from nowhere. They were previously rising in the ranks before becoming top 20 languages.)
Common Questions About the Rankings
Why do you create these rankings?: These rankings attempt to correlate trends between language usage and discussion around a language. We don’t proclaim our rankings to be precise, statistically-valid measurements of popularity; instead we see them as an attempt to aggregate trends across two major communities.
How do you create these rankings?: Please see the full analysis for a complete description of the process, but at a high level we measure traction as seen via GitHub pull requests and Stack Overflow discussion.
Why GitHub and Stack Overflow? That’s going to over-represent/under-represent certain communities.: Agreed, these measures are imperfect. More specifically:
- We don’t claim these rankings are representative of broader use (i.e., we do not claim that language usage as seen on public GitHub repos is equivalent to total language usage).
- Communities often connect in forums outside Stack Overflow. Unfortunately, we cannot run a separate query process for a hundred different languages across a variety of forums that range in openness of data availability.
- We use GitHub and Stack Overflow first because of their size and second because of their public exposure of the data. We encourage interested parties to perform their own analyses using other sources.
Don’t incumbent languages have an inherent advantage here?: Indeed they do, as the metrics from GitHub and Stack Overflow are accretive. While rates of growth will be fastest for new projects with a smaller base, from a cumulative perspective new language entrants are behind from the day they are released. Displacing the most popular languages is a significant and uphill battle.
Has your process been consistent over time?: We’ve tried our best to keep things as consistent as possible, but we had to adapt to changes in data availability from GitHub in January 2014 and again in January 2017. You’ll notice there is higher than typical change in those periods; the linked posts above may be helpful for those trying to sort out change due to process and change due to adoption trends.
CSS is not a language.: This is inevitably raised every iteration of this analysis. There is probably someone who wants to debate this with you in the comments or on Reddit / Hacker News. While we mostly stay out of the debate on this particular topic these days, we welcome this grand tradition.
Related RedMonk Programming Language Rankings Posts:
- January 2021
- June 2020
- January 2020
- June 2019
- January 2019
- June 2018
- January 2018
- June 2017
- January 2017
- June 2016
- January 2016
- June 2015
- January 2015
- June 2014
- January 2014
- June 2013
- January 2013
- September 2012
Credit: My colleague Rachel Stephens–who is currently on leave–is responsible for the current design of the RedMonk Language Rankings Over Time chart (and kindly left us excellent and detailed instructions for generating the chart in her absence). She is also responsible for the majority of the information on “Interpreting the Chart” and “Common Questions About the Rankings.” Any typos or formatting inconsistencies are mine.


No Comments