Join RedMonk as they talk to the Chronosphere team about their approach to observability.
- Landscape overview from Rachel Dines, Chronosphere Head of Product and Solutions Marketing
- Product discussion Julia Blase, Chronosphere Product Management Lead
- Slides and awesomeness from Shelbi Gomez-Poston, Chronosphere Sr. Manager of Analyst Relations
This was a RedMonk video, not sponsored by any entity.
Transcript
Rachel Stephens: Hi everyone, welcome to RedMonk What Is/How To. I’m Rachel Stephens, I’m a Senior Analyst with RedMonk and I’m here with my colleague Kelly Fitzpatrick and we have the Chronosphere team with us today.
One of the things that is great about RedMonk is that we get to talk to a lot of really interesting and intelligent people in our jobs. And every once in a while we have one of these calls where people are talking to us and they’re explaining problems in a really interesting way or talking about how they’re addressing the market in a way that’s really compelling and like, Oh, I wish that we could share this with the whole world. And so what we are doing today is actually just taking a conversation that Kelly and I really loved and sharing it with the whole world.
So we have the Chronosphere team with us. We have Rachel Dines. She is the head of product and solutions marketing. We have Julia Blase, who is the product management lead. And we have Shelbi Gomez-Poston, who is the senior manager of Analyst Relations, all at Chronosphere. And they’re basically just gonna walk us through their presentation that they gave to the RedMonk team, but just so everyone else out there can enjoy it as much as we did. So I’m gonna turn the floor over to Rachel and I’m gonna let you all kick it off.
Rachel Dines: Thank you so much, Rachel. Thank you for the kind words. When two Rachels get together, great things are going to happen.
Rachel Stephens: Absolutely.
Rachel Dines: So yeah, I’m gonna just start by walking you through a little bit of the background on who are we, who is Chronosphere? And that I think will help give some perspective on also the technology advancements that we’re gonna walk through with Julia in a few minutes. So just to start you off, if you’ve never heard of Chronosphere, we are an observability platform.
And we are really hyper-focused on companies that are adopting cloud native. We’re gonna say cloud native a lot. And I’m gonna just warn you that when we say cloud native, we mean that as a shorthand for microservices and containers and people adopting those things in various stages of their journey, right? They might be all in, you know, or always been on cloud native. They might be an enterprise that’s just taking the early steps, but that’s what we’re here for is cloud native. And the backdrop behind that is because Chronosphere’s roots actually go back to the observability team at Uber. And when Uber was a really early adopter of Cloud Native, like in the 2014, 2015 time frame.
And Chronosphere’s two founders, Martin Mao and Rob Skillington, were running the observability team, and they were trying to figure out what they could do to monitor their microservices and containers environment, which was growing really fast. It was generating a ton of data. And they tried pretty much everything out there on the market. Every commercial off the shelf solution, every open source tool, nothing worked for them. So they ended up building their own backend for metrics and for traces, and they open sourced them. They actually built a backend for logs too, but unfortunately never open sourced it. And in 2019, when they realized, hey, the whole rest of the world is going cloud native, this is not just us, they decided to leave and found Chronosphere.
And the technologies and the experience that they had operating the observability platform at scale is really now the foundation for our platform and our solution. So fast forward four years, we’re now trusted by some of the largest cloud-native companies in the world and are running really large-scale deployments of observability in our SaaS solution. So that’s a little bit of history of who we are.
I want to also tell you just a bit about why people choose to work with us. This comes from me running around and talking to as many of our customers as I can. And I say, “why do you choose to work with Chronosphere?” Once again, early or late stage on their cloud native journey. These are the three major things that bubble to the surface. The first big one is that they need to exceed their customers expectations. So their customers have very high expectations of performance and availability and they need an observability solution that can match that can meet that. That can be really reliable. We have customers that reduce their sub-zero and sub-one incidents by like 75%. So, if they can find and fix their customer issues faster, they’re making their customers happy. That makes them happy.
Another really big reason for this is that customers choose to work with us around controlling the cost of observability. This is something so often I talk to companies that say observability is like the second most expensive thing in their environment after their cloud infrastructure.
And so we have a lot of really great innovations in this space that actually, where Julia is going to talk about a lot today. And so we can help customers align their observability costs to value. And typically they’re reducing their data set by about 60% through our control plane. Not going to go much deeper than that because there’s a lot that goes into this. And Julia is going to explain some of the secret sauce. SOME of the secret sauce, not all of it here.
Kelly Fitzpatrick: But I absolutely can confirm that cost is something that we’re hearing more and more as a concern around observability.
Rachel Stephens: For sure.
Rachel Dines: Yeah, not surprised. I mean, I feel like every other week there’s a new Twitter or Hacker News thread about costs of the big dog and how to reduce them. And the thing is, I think people wouldn’t mind the increased costs if they were getting more value. And that’s just not necessarily the case. So aligning cost of value is how we like to think about it. Like, you know, I’m willing to pay more for something that gives me more value. Sure. But I don’t want to pay more for something that gives me the same or less value. So it’s great to hear that you’re seeing that as well, I mean, it’s not great, but we’re here to help solve the problem.
And then the last piece of it, which is kind of related to cost if you think about it is companies wanna improve developer productivity. So they have a certain number of engineers and a certain number of developers on their team and they likely can’t hire a ton more. So if they need to deliver more features, they need to get their engineers out of troubleshooting, out of the weeds, out of waiting for slow dashboards to load and get them back into just spending more time innovating. And so this is where we see customers reducing the amount of time they spend troubleshooting by hundreds and thousands of hours a year.
So I’ve mentioned Cloud Native a few times, and I want to just quickly backtrack also and talk about why do you need a different approach to observability with Cloud Native? And the underlying reason behind all of this really comes down to data. So in the past few decades, if you’ve been around, you’ve got a little bit of gray hair, like me, not too much gray hair, you probably remember we used to live in a world of monoliths running on hosts and data centers. We had great monitoring tools for that world, like the CAs and the BMCs and the solarwinds. But very quickly, as we moved into cloud and virtual machines, those tools got disrupted because they couldn’t keep up with the speed and the scale. And that’s when a lot of what I usually call the Gen 2 kind of monitoring tools came about, like the Datadogs and the New Relics. And they were incredibly disruptive and are now the major player today.
But at the same time, we’re going through another generation of infrastructure where people are now adopting microservices and containers. And where you used to have tens of services, you might have hundreds or maybe even thousands of microservices and you used to have thousands of VMs, you might have millions of containers. This might be a bit hyperbole, but there really is the increase in scales, anywhere from five to 10 to maybe even 20X. I don’t know if you all see this as well.
Rachel Stephens: Definitely. Well, so I think one of the things that people watch this market are going to say like, well, there are some other new people on here, kind of a Honeycomb or Lightstep for people who also play in this space. Do you want to talk at all about how you play with them compared to some of the previous gen as well?
Rachel Dines: Yeah, it’s a good question. And I just conveniently forgot to put them on this slide. My bad. So those are the other players. So yeah, we’re not the only ones in this third generation of observability tooling, right? Honeycomb is definitely one I would consider direct head to head with us. Grafana as well. Lightstep, a little bit less so since being acquired by ServiceNow, but very much still a tool that is in this Gen 3 space. We have a lot of ways that we are different and actually think we’re going to highlight on the biggest, most important one in just a few minutes in Julia’s section, which is the control plane.
So the important thing to note about this slide is that with each step along the way, observability data is getting greater and greater. So if you had, you know, a thousand servers and each server admitted a certain amount of telemetry, certain amount of metrics, certain amount of traces, certain amount of logs. Now you have an exponential number more containers and those containers are emitting the same amount of data that each one VM was. So just on that factor alone, you’ve got a lot more data. And the thing is you need this data in order to be able to like operate these high volume, high speed environments, but a lot of it is actually not that useful and it’s hard to find what you’re looking for.
This trend is fundamentally what we’re built to solve, right? Is to help make sure that the observability data is not growing out of control, making costs grow out of control.
So the last thing I wanted to share with you before I hand it over to Julia is one of the new innovations that we recently brought to market — well it’s not an innovation, but one of the new services we recently brought to market, which is a professional service to help customers migrate off of those Gen 2 tools onto Chronosphere, which is a Gen 3 tool. And because most people are using something for observability today, right, whether it’s a data dog or a new relic or signal effects. We created this service to help customers clear the hurdle of migrating from other vendors. The important thing that I would call out with this is any part of any migration, there’s both the technical side, actually getting the telemetry in, moving the dashboards and all of that, but there’s also the training and enablement, which is so, so important.
And so we focus equally on both sides of this coin and we can actually natively ingest data from most of those incumbent gen 2 tools as well. So this is just something that we’ve put in place recently and seen a lot of uptick from it to help customers get over that hurdle. So that’s all we had on the business side, but I’m really excited to hand it over now to Julia, who’s gonna talk about some of our latest innovations on the product side.
Rachel Stephens: Sounds good.
Julia Blase: Yeah, thank you so much, Rachel. Rachels, really, for having us and for giving us that great introduction. I’m Julia Blase, a product management lead here at Chronosphere. And as Rachel said, I really wanted to talk about a few of our recent innovations in the product space that help our customers address some of their most pressing concerns in cloud native observability. So as we look at our customers and as we talk to people across the market, we really live and breathe observability for cloud native. Everyone we talk to works in microservices, works in containers, works in pods, works in the cloud. And we hear very common themes from all of these people. So the first theme that we hear is that they struggle with reliability. Whether it’s a homegrown solution or a legacy solution or another solution on the market, we hear that our customers really struggle to manage reliability and especially reliability at scale as their platforms and customer bases grow.
The next challenge we hear them talk a lot about is data explosion. So speaking of that growth, it doesn’t just present challenges in reliability, it presents challenges in understanding what you have and navigating what you have, right? You’ve got mountains of data and it’s changing all of the time and it’s dynamically scaling as your customers log on to your system at 9 a.m. on a weekday. And not all of that data is created equal. I think as Rachel also said, you might not be willing to pay more if you’re getting more value, but sometimes it’s just more strange library metrics that you’re getting in your system that you don’t need. And that’s very frustrating for a lot of our customers.
And then the third challenge we hear people talk about is developer inefficiency. What happens when developers can’t find what they need? They spend hours and hours looking for it and those hours contribute and delay MTTR and eventually even block it and the developer can’t solve an issue themselves anymore and instead has to pick up that bat phone and call that one SRE at the company who you remember happens to know everything which is very frustrating, right?
So in response to these challenges, we really focus our product strategy and our product innovations on three areas. So in response to reliability, we want to deliver confidence. In response to data explosions, we want to deliver control. And in response to developer inefficiency, we want to deliver that context. I’m gonna talk about each of these three things in a little bit more depth as we go forward, starting in fact with confidence.
This one’s pretty straightforward. We promise three nines to our customers and we deliver four nines. That’s it. You know, it’s a simple story, but I think it’s really impactful, especially given the scale of data that our customers see, especially given the growth that we see even quarter over quarter in the customers we handle. This is a very important place for us and it’s a focus for all of our product teams to be able to continuously deliver, and really over deliver and exceed our customers expectations for the reliability of their observability platform. That data means nothing if you can’t access it. And so that’s a critical place for us to focus our time.
Rachel Stephens: And I’m going to interject real quick. So I think we de-instaurated by saying cloud native. You’re talking about your reliability of the platform. All of these things really imply that this is a SaaS service offering and people are not running this on prem. But let’s just clarify that for everybody. Is that accurate?
Julia Blase: Absolutely. Yes, this is a SaaS offering. People are not running this on-prem. And in fact, something I’m going to talk about is, we’re also very open telemetry compatible, and we keep growing in that space so that you don’t have to run anything from Chronosphere in your own environment, both for management ease, right? You don’t want to manage something. You pay a company to manage it. You don’t want to have to manage some of their own things in your environment. And also for security, right? This is still a concern for customers. They don’t want to run a third-party software inside their security boundaries. So we are a SaaS platform offering, and we continue to invest in open source compatibility so that customers can just send us the data they have and don’t need to run anything from us in their systems internally. Which is another place, I think, where we’re differentiated from some of the other competitors in this market, who might ask you to run one of their collectors, for instance, or some kind of other system within their security boundaries before they egress data to the SaaS provider.
Rachel Stephens: Yeah, thank you.
Julia Blase: Yeah, absolutely. Yeah. Good question. And thanks for asking me to clarify. So that’s it on reliability. Like I said, pretty straightforward. Let’s move on to control.
All right. So our control strategy is really focused on helping our customers make good decisions about their data, right? We don’t want to do anything that isn’t transparent. We don’t want to do anything for our customers without them giving us their input and making those decisions independently of us. We’re just the platform provider. We don’t know their data. So our control plane is really focused on giving our customers the tools that help them analyze all of their data, make good decisions and refine that data based on the analysis, and then, of course, continuously operate that control plane tooling in a way that makes sense and is easy and is adaptive and dynamic because their data and their systems are changing all of the time.
As we think about analysis, that first phase, we’ve got a couple of key tools that we provide to our customers to help them with this. The first one, of course, is our metrics traffic analyzer. And I bring this up — it’s not an innovation, and I actually bring it up deliberately because it isn’t. This is something that Chronosphere, if you’re not familiar, has offered out of the box from the get-go. And it’s a way for our customers to view and analyze their metrics live, streaming, as they come into their SaaS platform, and for free. So we let our customers use this tool before asking them to pay for any of their data, because we know that the first thing they need is transparency into what they’re producing. What volume, what labels, what cardinality, what does this look like?
Let me see my data before I make any decisions. And also before I decide to pay you for any of this data, because I may not want some of it. And we don’t want our customers to pay for things they don’t need or they don’t want. This is also kind of a core piece of our disruptive pricing model. I think I mentioned this, but again, we don’t ask customers to pay us until they’ve looked at their data with our tools and decided what they want to keep. And I think that’s a real critical way of how we help our customers reduce those costs, right? We don’t say pay us something and then pay us again to enrich it. We say, pay us nothing, look at your data, make your decisions, then pay us post decision-making based on your understanding of the value of the data that you wanna keep. I think that’s a really core piece of our brand, a core piece of our identity, I think, if you ask Martin and Rob, this is something they just feel is very critical, especially in this cloud-native world where so much of your data is a mystery. So again, I bring that up not because it’s innovative, but because it’s a core part of our brand and that we keep enriching on this core part of our brand.
So the thing that is new for us is of course the metrics usage analyzer. And this takes that set of data, you know, what is coming into my system and enriches it with additional information about how people are using the data. So let’s say you take that metrics traffic analyzer, you say, ah, I don’t need some of this, but I do want some of that you ingest, you pay us for that data. Well, how are your developers using that data over time? Right. This might change as well. And this might update as new services are added and new teams are formed. We wanted to give people insight into that.
Now that you’ve decided to keep this data, is it useful? How is that utility changing? And the Metrics Usage Analyzer lets our customers rank all of the metrics in their system from most used to least used, and then make data-driven decisions about their data based on that additional information. Again, a very crucial part of helping our customers to control their costs over time. So if you think about Traffic Analyzer, it’s how do you control your costs out of the gate?
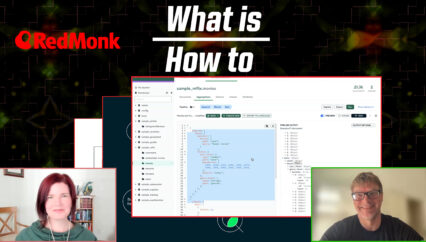
Metrics usage analyzer, how do you control your costs over time? How do you adapt? How do you make sure that you’re only presenting your developers with the things that they’re going to use and continuously make your system better and more optimal by dropping data that no one’s getting any utility out of. The usage analyzer also doesn’t just provide counts of usage. I think a critical part of this is that it gives people insight into that usage details. So let’s say that you see that a particular metric is used very heavily. Let’s say it’s near the top of your usage list, but you’re not familiar with that metric. You can actually go into the usage details screen as you’re seeing right now in this little video, and you can look at that dashboard and you can see what that usage is. And maybe you look at the dashboard and you say, oh, this is a dashboard and I can see that I have 20 new users every month. That’s because that’s my onboarding class. That’s my new hire class. It looks like it’s a new hire dashboard.
So people are using this metric pretty heavily, but they’re people who are brand new to my company. And in fact, I don’t see any names on the user list who are people who’ve been here a while and who I value their opinion. So let’s say you look at that metric and you see that it’s a particularly high cost metric. Now you have the freedom to say, hey, onboarding class leader, let’s change that dashboard. Let’s fuel that dashboard with something that’s lower cost so that I can drop the high cost thing and give you something again to play with and to train people on that’s not gonna cost me as much money in the longterm. And we’ve seen customers take this metrics usage analyzer and particularly that details page and use it to make even those more enriched and sort of business focused decisions about how they’re using their data and how they’re pushing that down to different teams in their business. So it’s been really exciting. We’ve gotten very positive feedback on this. And I think it’s a place where again, we’ll continue to invest in, see what insights people want to drive from this and try to make those more and more easily accessible and usable for their business operations as they go.
Rachel Stephens: Wonderful. So quick question. We talked about the volume of data that people are dealing with and what you just described is kind of like the deep analysis into one kind of metric that might be causing problems. Can you talk a little bit about how the metrics analyzer works kind of in mass and bulk? Is it rules based or how are people thinking about that?
Julia Blase: Yeah, absolutely. So I think that metrics traffic and usage analyzer, they do give you broad categories of data that maybe is unused or underused. Now that you’ve identified that data, and again, it also gives it to you in that sort of ranked list, you don’t have to go identify it. You can see it all as it relates to each other, which was a critical thing for our users. Sometimes something is most used, but also most costly, but the next thing on the list in terms of utility is really low cost. So it’s helpful to have them in that ranked list next to each other so that you can make decisions in mass about what to do with data that falls into different categories, which actually brings us to the step, Rachel. So that was actually a great transition question.
So we do offer these refined capabilities to our users out of the box to help you make decisions based on that information. So you’ve used the traffic analyzer, you’ve used the usage analyzer. Let’s say you’ve identified metrics that you don’t care about keeping. You can do a few different things with those metrics to get them out of your system to keep you from having to pay for them. You can reduce them or drop them entirely, right? Like that’s step one. Like I don’t want to see these anymore forever, take them away. And we give you drop rules out of the box. Again, those take effect within, I think, 30 seconds typically. So you can be very responsive with your drop rules, especially if you see like a sudden spike in traffic in your traffic analyzer. And they’re also reversible just as easily. So let’s say you see a sudden spike in traffic, you add a drop rule, but all of a sudden some SRE again comes knocking on the door and said, hey, I picked up the bat phone and I need that one metric to answer this problem. It’s really easy to reverse that drop rule and get them back the metric that they need. Similarly, two drop rules, you can actually do other transformations, like you can aggregate data.
So let’s say you find that you have a metric that split up, maybe you have one metric for each node of your database service, right? Let’s say you don’t actually need individual metrics. You just care about the sum of the information across all the nodes. You just care about like the database metrics in aggregate. We let you use our aggregator to roll up those metrics together. You can even drop the raw data after that point and keep and persist only that aggregated more useful data. So it’s another way that you are reducing while keeping the valuable signal. And in fact, often what we see is that aggregate data gets a higher utility score than any of the individual pieces formerly did, because that’s just how people want to access it in general. You can also do things like downsample, or, and this is actually new for us as well, we’re doing more advances in control for other telemetry types, like for our trace data as we continue to push into that market. Trace data, a little bit different from metrics data in terms of what is valuable. For metric data, what’s valuable is what’s being used.
Right, metrics are ubiquitous, they’re high volume, they’re everywhere, you don’t need all of them. Trace value is less about what’s used on a regular basis and more about what you need right now when an incident is happening. So trace value is very time bound and really tied to what’s actively going wrong or what’s actively slowing down in my system right now. Control for tracing has always been, I think, a challenge for the market because as you think about doing tracing, you’re talking about sampling rules.
You’re talking about turning up trace data or turning down trace data. And the thing that has the highest impact on your volume of trace data is that head sampling rules that you set up. So that’s sort of at the source, what the service emits in terms of trace volume. And often in the past, changing that head sampling rule requires you to re-instrument your code and redeploy your service. Huge lift, right? So what do people do with tracing? They set a really low head sampling rate.
And they just kind of hope that captures what they need over time. As we thought about control for tracing, something that was important to us out of the gate was to let you dynamically adjust the head sampling rules. So you can actually, in Chronosphere today, set your head sampling rules in one single central location, and then have your services pull new rules from that location as often as 15 seconds so that you don’t have to do a redeploy. You don’t have to do a re-instrument.
You can look at a dashboard, see that something is happening, up sample all traces for that service or operation starting 15 seconds from when you make the change, and get the higher value trace data that you need just for the time that the incident is ongoing and turn it down again quickly afterwards. So it’s a really interesting challenge for us. So we really tried to listen hard to our customers here and understand trace value versus metrics value and build a control plane that addressed that need out of the gate.
Again, when we talk about containers too, and microservices and cloud native, all this stuff, metrics data is high volume. Look at trace data. Trace data is massively high volume, even bigger than metrics, right? A single service or operation can emit millions of spans per second, billions of bytes per second in trace data. So really being able to give customers out of the gate a control plane offering that lets you refine based on time for your trace data was critical for us.
So that’s something that we’ve been delivering so far that our customers are really loving. And that I think will continue to provide value and will continue to invest in making that more and more automatic and responsive to customer needs. I did again wanna say that this is all open source first. So none of this requires you to do anything custom to Chronosphere, this is just something that comes as part of the platform and is open telemetry compatible.
Rachel Stephens: Wonderful. All right. Do we have other things? Okay, we still got more.
Julia Blase: All right. Yeah, I have more. I have more control. We’re all about it, as Rachel said. So that last phase, right? You’ve set up your, you’ve looked at your traffic and analyzed it. You’ve set up your refine rules, drop rules for metrics, head sampling rules for tracing. Now you wanna kind of operate your platform continuously and you’ve got a lot of rules happening. You’ve got a lot of data changes happening. So this last leg of the control plane is about innovations and how we help our customers continuously manage and operate their control plane system.
The first thing here is really just, again, leaning into that transparency and leaning into that need of our customers to have a UI for everything so that they can see what decisions they’ve made and track them over time. So when we talk about this, we talk about things like our rules UIs. All this control stuff may happen in sort of a version controlled GitOps way, but we want to surface that to any user of the platform so that they can see at any point in time in the same platform as they see their data, the rules that are acting on their data. Very crucial for our customers, what rules did I set up? When did I set them up? When did I last change them? How have they been impacting my data over time? If that rule is doing a transformation, are people still using the transformed data as much as they were in the past? Do I need to maybe adjust a rule because the data that it’s impacting has changed? So bringing that control plane into the UI, giving people an experience in the Chronosphere platform so that they can kind of see and track and make adaptive changes was really crucial for us.
The next thing here, and the last part of the control plane that I’ll talk about today, is the way we let people sort of allocate their budget. So with Chronosphere, right, you say, okay, I’ve seen my data, I wanna keep this portion of my data. Chronosphere, you know, give me my budget, okay, that’s X data points per minute, or that’s Y gigabytes of traces per month. And then what our customers often say is, I don’t wanna pay overages, don’t let me go over that. Great, how do we help our customers understand and keep their spending within their budget? We do it with this quotas and priorities offering. So the last part of the control plane is letting you split up your system in a way that makes sense to you, which is often sort of by team or by set of services that have a similar owner. And you might give all those similarly owned services a quota. So, hey, of all my budget, I wanna track it in chunks and I wanna track those chunks in terms of things that are owned by individual users who I can go talk to if there’s a problem or a spike or a sudden need for more trace data. So our Quotas platform lets customers sort of subdivide their budget, track it per team, and then gives them a quick sort of access point if a particular team’s budget seems to be growing more quickly than expected so that they can go understand what the need is. And it also lets our customer set what happens if a team goes over its budget. So I think often here what we see is people say, hey, I want to take my budget. I want to split it up into high, medium and low priority traffic. And if I go over my budget, just drop my low priority traffic, which is often traffic that may have a lower utility score, right? It’s not used as much. Maybe I access it once a month. I don’t want to drop it entirely, but I’m comfortable dropping it. If I go over my budget because of a spike in some other system that I own. So quotas and priorities again, just give our customers a little bit of a better way to understand all of these moving parts by team, by individual owner and then to govern behavior in case of unexpected things happening like a sudden spike in traffic.
All right, that was control. Again, a big part of our product offering in a place we continue to invest because of our customers concerns about cost and data explosion and managing costs and value, but I don’t want to forget about context, right? Our customers often also deal with that. Hey, I’ve got so much data and my, my developers spend more time looking for the right data than solving the problem. So a couple of things I wanted to talk about here today, again, some recent innovations here.
This first one is Chronosphere Lens. And this is a way that we help our users take all of their telemetry in the platform, metrics, logs, events, traces. And what we’re helping our customers to do is connect them across shared business values. So what does a customer think about? Not, you know, container node X, pod Y, thingamajig and the other. Customer thinks about my service. You know, my aggregation service, my login service, my payment service, and they think about environments, my payment service in production, my payment service in my testing environment, right? So we’re helping our customers connect telemetry data on those dimensions so that you don’t have to go and remember how to type in all the specific prom QL to get all that data in one page. Instead, you just go to something like a service homepage and you put in production and you put in your service name and you get all of the data summarized for you in one place.
Chronosphere Lens really helps our customers not have to translate their business context into some telemetry speak, which is just, again, I think more and more critical as that data volume grows and as those microservices grow over time. And even as you have lots of different telemetry types in your platform, I think a place to your point, I think about other people in the market right now, a place where we see people struggle is, hey, I’m in this other platform and I have to go to three totally different UIs to find my trace data and my metrics data and my events data. And all those UIs look different and they all have a slightly different query language and production is spelled prod in one place and prod one, prod two, prod three in another place and production in the third place. And I have to keep that all in my head and I’m so frustrated. And we’re really trying with Chromosphere Lens to give people a single page, a single way to navigate their data so that they don’t lose that context and have to relearn how to query their data in different UIs throughout time.
We’re really excited about this. I think we also have a long way to go with this, but we’re building this very closely in line with our customers right now to make sure that this meets their needs as their telemetry types and as their telemetry volume grow.
Kelly Fitzpatrick: To jump in real quick, one of the things that I think we try to kind of frame in What Is/How To, when we talk about the world of software through this lens is, what is an issue that people are dealing with? And I think you articulated that one very, very well, even though the solution is still a work in progress, I think this is a problem, the kind of context switching about going from place to place. And as you said, having to learn different versions of telemetry speak. I think that’s a very real problem that a lot of technical practitioners face. So thank you for that.
Julia Blase: Yeah. Thank you. I mean, we can only speak in the language of the problems that our customers face, honestly, right? Like what are we doing otherwise? So I really appreciate you calling that out, Kelly. Yeah, this, this one is so hard. This one is so hard for our customers today. And I think it blocks adoption. It blocks MTTR, right? It just slows everything down because now as a developer, you don’t just have to learn Java and Python and Ruby. You have to learn PromQL and this tracing API and this other thing. So the more we can reduce that in our platform, I think the more we’ll be able to deliver solid value to our customers.
I did mention a few different telemetry types there, and of course I wanted to highlight that a new thing we’ve just introduced is also events or change event tracking. So just wanted to pull this out briefly because it is another crucial part of our customer workflows. I got an alert, I go to my monitor, everything is red. How do I get out of red? How do I get past like, what can I do so that I can calm down and take a deep breath and root cause in a way that’s like less scary and high time pressure. Often what people search for is what’s changed. What can I roll back? When were things last in a good place? And how do I get back to good so I can take the thing that changed and interrogate it more deeply in a safer space with maybe more of those experts on the line to understand what happened. So we’ve recently introduced change event tracking. And again, I wanna say this is not a separate UI and it’s not a separate language.
It’s actually in the context of customers, monitors, and dashboards, so that you can just push a button and see recent changes to your system, so that you can help maybe roll back things faster, get back to a good state faster, and spend your time root-causing with experts during daylight hours when everyone has had their coffee. So again, another important way we’re trying to bring that context to our users, bring it in the same place they’re looking at all their other data and help reduce MTTR even in a complicated changing microservices environment.
Rachel Stephens: And I appreciate that you had the back to good things. I had a momentary geriatric millennial throwback to Matchbox 20, which I appreciated.
Julia Blase: Hahaha
Rachel Dines: You’re speaking my language, Rachel.
Rachel Stephens: Sorry, carry on.
Julia Blase: No, no, no. All good. That actually wraps it up. So I think that just highlights again some of those recent things we’re bringing to market in response to customer challenges. Just to summarize, as we sort of say our thank yous and goodbyes, what we hear people talking about, what we hear cloud-native organizations talking about, is their struggles with poor reliability, with data explosions and with developer inefficiency, we focus our product strategy on delivering innovations and confidence, control and context to help people continuously adapt to what they’re seeing in the market and address their challenges and reduce at the end of the day and mean time to resolve. Okay, thank you so much, everyone.
Rachel Stephens: Wonderful. My one question that kind of came up multiple points throughout both of your talks is you talked about talking to customers and caring about customer feelings. When you’re working with these teams, are you mostly talking kind of at that SRE platform team? Are you talking to developer teams? Is it both? Like who’s your buyer? Who’s your user?
Julia Blase: Yeah, great question. I think often we’re talking to both, as much as possible we’re talking to both. I think our buyer tends to be sort of more in that SRE administrator central observability team space because they’re often in charge of the budget for any software that you’re going to purchase or supply to your developers, but they care deeply about adoption. So we’re talking to them and we’re also talking to kind of individual developers on their teams or on teams throughout their organization because they also want to buy a product that people are going to use. So as much as possible, we’re talking to both even if the buyer ultimately is more in the SRE central observability team role.
Rachel Stephens: This was absolutely delightful and I really appreciate you all taking the time to come talk with us again and to share this story. We really enjoyed it and we hope everyone else out there does too. Kelly, any final words?
Kelly Fitzpatrick: Thanks everyone for their time today.
Julia Blase: Thank you all so much. We really appreciate it.