Join RedMonk’s Kelly Fitzpatrick for a conversation and demo with PagerDuty’s Jake Cohen (Senior Product Manager) on automated diagnostics, process automation, and incident response. It’s all about automation helping first responders determine if there is an issue, which domain experts (if any) should be brought in to assist, and resolving the issue as quickly as possible.
Related Resources:
- Solution Landing Page – Automated Diagnostics
- How to Get Started – Rundeck Automation
- Podcast – Runbook Automation with Jake
- Blog – What is Automated Diagnostics and Why Should You Care?
- Learn More – Automated Diagnostics Solution Documentation for PagerDuty Process Automation
Want to digest this video in two parts?
Transcript
Kelly Fitzpatrick: Hello, welcome. This is Kelly Fitzpatrick with RedMonk here with another What is/How to video. Today’s topic: What is automated diagnostics? How to reduce escalations and accelerate resolution with automation. With me today is Jake Cohen from PagerDuty. Jake, can you tell us a little bit about who you are and what you do?
Jake Cohen: Sure. Everyone, I’m Jake Cohen. I’m a Senior Product Manager on the process automation team here at PagerDuty. So I’m involved specifically with our solutions and integrations built on top of the core platform of process and runbook automation, which is PagerDuty’s Runbook Automation product suite, product line. And I’ve been helping out with this solution that we’ve been calling “automated diagnostics”. So that’s why I’m here and happy to be here.
Kelly: Well, thank you for joining us today. Before we get started, I wanted to talk a little bit about two things. First, automation, which is a topic that it seems so ubiquitous now. We talk about automation for everything network automation, infrastructure, automation. And two words that I already heard you say, Jake: process automation and maybe use said runbook automation. Maybe you didn’t. Maybe I heard something you didn’t say, but I feel like both of these concepts are central to what we’re looking at today. Process automation being how our business processes get automated (and sometimes very technical business processes at that). And then the second thing I think that it’s really important to call out now is the topic of incident response, which if you’re already familiar with PagerDuty, this is something that you you’ve already thought about. You already have this in your vocabulary. But what we’re seeing at large in terms of incident response is it’s becoming a bigger and bigger deal for organizations as we see people having to scale things and support things at scale and having more things that are up and running that they have to worry about falling down or issues arising in. So how organizations manage incidents is becoming, I think, something that people are paying more and more attention to. So given that kind of slight bit of context, Jake, what can you tell us about what is automated diagnostics and what does it have to do with incident response?
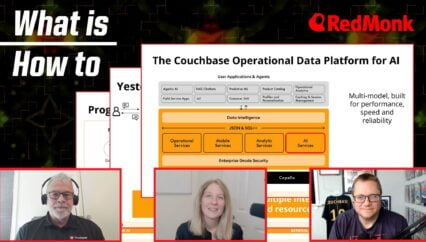
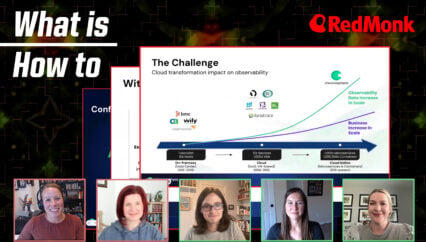
Jake: So as you mentioned, automation has become fairly ubiquitous. So it’s good for us to be specific about the type of automation that we’re talking about. And there’s workflow automation, process automation. And then there’s business processes automation that you alluded to. And so we’ll dig into the type of automation that we’re talking about and where it fits in specifically into incident response. So what we’re what we’re looking at and to provide the context for the conversation here is during an incident, there’s the different stages of people responding to the incident. And as you mentioned, those who are familiar with incident response and PagerDuty are fairly familiar with this notion of being on call and needing to escalate to people and running response plays. And automation fits into these different stages. What we’ve pulled up here and the reason I pulled this up as our first slide to set the context for this conversation is that even with different types of automation plugged into the incident response process, we are still seeing this pattern of numerous people being interrupted or pulled in to assist with incidents. And that’s what this slide is is really telling us, right. Is that over the course of the duration of an incident, we’re going from 4 to 8 to 16 to 25 people pulled into a Zoom bridge or a Slack channel or a Teams group that respond to an incident. So that’s setting the stage for where we’re going to talk about where we’re on an automated diagnostics fits in.
Kelly: And one thing I love about the slide is that it captures not only “Here are all the people that are getting pulled in at all these different points,” but the time that is elapsing, the amount of time it just takes to pull these people in and to figure out who do you actually need on this call to figure out what is happening with the incident and also move towards a resolution. And it reminded me of in preparing for this, I took a look at a blog post from PagerDuty on “What is automated diagnostics and why should you care?” I love that title. And one of the statistics there was that 50% of responders’ time is spent on determining who is needed to be brought in to support the incident and then trying to figure out if there actually is an incident. I thought that was a very striking statistic. I think this slide kind of captures that in a more visceral way.
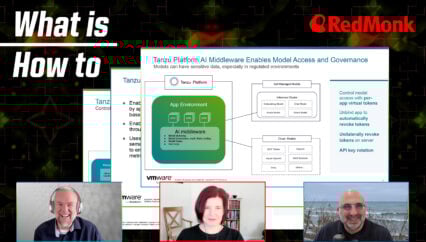
Jake: And that fits right into what we’re talking about with automated diagnostics. And so I wanted to pull this up also, just to be specific about what we’re talking about when it comes to automation within incident response and where this thing that we’re calling automated diagnostics that we will define here in a second fits into the end-to-end process. And this is how PagerDuty tends to look at the stages of an incident. And so what you see on the far left here are all of these events and signals that you as an organization use to determine and identify is something going wrong. And we are very particular in the words that we choose Here: “work, data, customer signals and events” is because these signals and events might come from monitoring tools, they might come from customer tickets, they might come from testing that internal users are running. And all of that feeds into our filter stage. So this is where we do alert grouping and aggregation and machine learning to identify “Is something actually going wrong?” And then we go into the mobilize and diagnose stage and this is where PagerDuty has made its name in bringing the right people in, people who are tied to a particular service where this alert originated. They do their work, we resolve the issue and then the learning stage happens. And that learning is both human learning, documenting “What did we do to fix this? What can we do to prevent this in the future?” But also PagerDuty’s machine learning to understand “Did we provide an accurate signal here?”
Kelly: And I love that learning is part of this process.
Jake: Where we want to focus our time today and answering this question of what is automated diagnostics is tying all of this together, the this notion of pulling people in and the different stages of the incident. What we have noticed is that even if PagerDuty is doing a great job of cutting out alert noise and de-duplicating alerts and identifying anomalies and pulling in the people who are tied to a particular service, there is still this pattern of that first responder needing to rely on other people because as it’s not surprising, there’s always going to be reasons that that first responder needs assistance, whether that’s because there are others in the team or in the organization who have a particular set of skills, they have networking expertise or Kubernetes expertise, those other domain experts have access to particular parts of the infrastructure and environment that that first responder may not have access to, or there’s just domain tribal knowledge of the organization in terms of what is connected to what, what checks need to be run before running a particular remediation. And so there’s still this pattern of escalating and pulling in other people. And so that’s what we’re showing here, right. Which is that in that diagnosed phase, a responder is pulling in a service owner, a network domain expert, and an infrastructure expert. And what each of those people tend to do are these technical tasks aligned and associated with their particular domain expertise. Right. So a service owner–maybe very well versed in Kubernetes–will check pod events. A network engineer is going to check routing and an infrastructure engineer is going to check logs and platform layer and so on and so forth. And so this is all alluding to what is what is automated diagnostics.
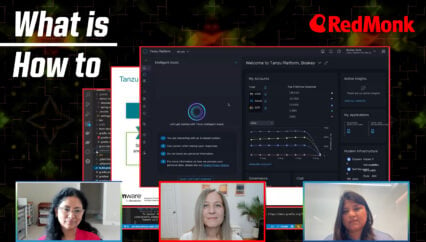
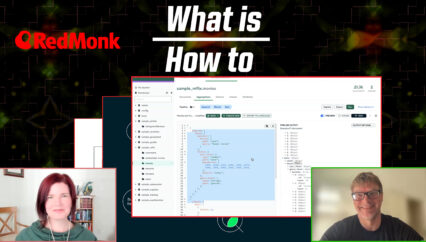
Jake: So what I wanted to do was just provide a visual of what are we talking about here in terms of automating diagnostics. And so what I’ve pulled up here is a sample runbook from from our wiki internally about how to handle a particular type of issue, a particular type of incident, right? How to handle “stuck transactions” in MySQL. And our customers have exactly this. They have they have SharePoint Docs and Google Docs and Confluence articles outlining how to handle very specific, very specific issues. What our product does is automate those steps. We start to see how to handle the alert. Step one: make sure you know which database server is affected. Step two: identify this stuck transaction. And what our whole premise is here is to codify and automate that domain expert’s investigation as is written here. And so we’re trying to do is take what you see on the left and turn it into what you see on the right. And what you actually see on the right is a number of different teams who have contributed to an end-to-end diagnostic run book. And what you see on the right is what will be executed programmatically and automatically. And that’s what we will go into in the demonstration. And so what this is demonstrating is, as the title says, emulating that domain expert’s investigation, this is really what we mean by automated diagnostics, is that when that incident occurs, can we replicate and emulate what the domain experts tend to check when they are first paged or messaged or pinged about an alert.
Kelly: What is I think very powerful about this is that yes, it’s the automation. It’s about how you how do you automate it, but it’s also about how do you put all this knowledge into one place that is not in one person’s head and not in these disparate sources and places that runbook information sometimes ends up.
Jake: Exactly right. Back to that learning stage or learning phase of an incident, we’d like to make this codifying of diagnostic runbooks part of that learning stage. So when an incident occurs or when we do an analysis of what common incidents do we have, can we start to look at what are those common queries and common checks that our senior engineers tend to take to figure out A: is something actually wrong? B: Is what’s wrong related to parts of the infrastructure that I own or my team owns? And and therefore by automating that, can we reduce the number of people that need to be pulled in?
Jake: And so what we’ll show in the demo, but this is a great summary of what we’re ultimately trying to do, is take those diagnostic checks and simplify them and put them where the responder is responding. So a lot of times our responders are not in our web app. They’re in there in Slack or they’re in the mobile app, and they’re going to get paged or buzzed about about an incident. And when we’d like to do is point them very succinctly, very simplistically, where to start their investigation or if they need to pull in someone that they know whom they need to pull in.
Kelly: So I feel it may be time to move into a demo, but as we do that, can you talk a little bit about what exactly are we going to see in the demo and what is the relationship between PagerDuty’s commercial products and some of the open source offerings that are out there?
Jake: Yeah, certainly. So what we’ll show on the demo is performing an automated diagnostic runbook or executing, I should say. And so what we’ll have is an incident that’s already been created by an alert from New Relic in this case about service and Kubernetes that’s not performing the way it should. So a synthetic check has failed. And then there’s gonna be a pod alert. And so PagerDuty’s is core product of Incident Response is going to be part of this demo showing just detection of that of that alert. And then what we’ll go into is running an automation action. And so that’s part of the Process Automation suite. That’s an add on to the PagerDuty core platform. Running that automation action is going to trigger a process automation job. A job is just our nomenclature for an automated run book. And so the Process Automation product is the commercial version of what was Rundeck Enterprise and Rundeck still has an open source core. It’s an open source project. It’s been around for about ten years now. And so what what we will be showing will have a lot of overlap with that open source product. But there are certain features that we might show that are only available to the commercial product, which is now that Process Automation product.
Kelly: Well. And with that, I think it is demo time.
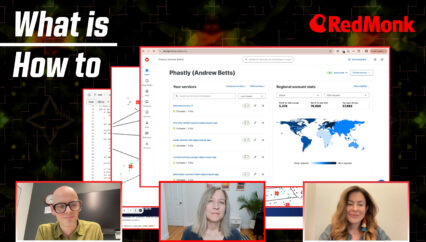
Jake: So here we are. As I mentioned, we’re in PagerDuty’s Incident Response product. We can see that I have an incident for my payment service. It’s actually called out which which pod specifically has gone into alert. And this is a good demonstration, it’s maybe on the far end of the spectrum of providing very little context to the responder in terms of what has actually gone wrong. But this is actually a good representation of a lot of monitoring tools, don’t supply a ton of context to that first responder. And so in those first few minutes of an incident, they’re beginning that investigation and diagnosis of “How bad is the issue? Is this actually an issue or is it a false positive?” And then leading to “Do I need to pull someone in?” What you’ll see here is that I’ve created a Slack channel already for my incident. And so that’s what we see here is through PagerDuty’s native integration with Slack, I created a Slack channel for people to start following and responding to this incident.
Jake: So what I am going to do now is click on this run actions button and this is where we see our automation actions add on. And what you see here are these predefined jobs or automations that responders can now select from and run on demand ad hoc.
Jake: I should mention, though, that with PagerDuty’s Event Intelligence add on as well, this can be run automatically as soon as that incident is triggered. I’m just for demonstration purposes showing that this can be invoked at the click of a button. And so when I go ahead and click that, it’s going to give me some context as to what is going to be run. It’s telling me I’m going to run a process automation type of action rather than just a script. And so I’m going to go ahead and click “Run Job” and then I’m going to tab over to our process automation interface. And you can see that that invoked our diagnostic job. You can see it’s our e-Commerce Platform Diagnostics. And when I jump into that, what we’re going to see is the verbose log output of this job, this diagnostic job. And so we can see again, we’ve got very dense Kubernetes logs. We have a check of target instances behind a load balancer and AWS. And then we’re also checking if there are any recent events from AWS’s status pages. And so we’re answering the question, is it also or is it them? And so at the end of it, it’s going to post the simplified output back to the incident timeline.
Jake: And again, this is in the web app, but as mentioned, most of our users are responding to incidents in Slack or in mobile. And so what you see is that simplified output right here in Slack. And so this is a very realistic situation where a person will have invoked that automation action from their mobile app or from Slack, and then they get this simplified output. Or, as I mentioned, it will be event triggered. And so by the time they actually get to the incident channel or by the time they are paged on their mobile, they already have this context available to them. And so what this is showing right, is that two of our checks failed: one for ELB, one for Kubernetes. And as part of the runbook that that was written by the domain experts across one team or multiple teams, it says, “Okay, if this check is unhealthy, go ahead and if need be pull in people from the DevOps Team or Platform Team.” And so this is a great demonstration of showing that as part of that runbook, I is a junior engineer or even a more experienced tenured engineer, know that if I do need help, who can I go to for help?
Kelly: And who should you go to for help as well?
Kelly: in terms of running checks on, say, like Kubernetes or AWS. How hard is that to set up? How does that work?
Jake: Sure. So we did want to spend a minute or two actually looking at the definition of this job and showing what’s actually happening under the hood and how difficult is this. So what I’ll do is actually go into the workflow definition. That’s what we see here. In my experience a lot of automation tools are code based and there’s YAML involved, and you can define these jobs as YAML. But what I do really like about process automation and the core product is that it gives you this option to see an extremely simple workflow definition like we see here. And so what you see here is step one is to identify the pods that are affected by this service that caused the alert. And then what we’re using is one of our prebuilt Kubernetes plugins. And “plugin” is just our nomenclature for an integration. And these are also available to the open source community. We do fully support them, but it’s been part of the open source project for awhile.
Jake: And what I wanted to point out here is that while we we provide a large library of plugins out of the box, the Process Automation and Rundeck products are really well suited to wrap around the existing automation and interfaces that teams are already accustomed to using. So in this case, if a team is very used to using the kubectl command line interface for diagnosing and troubleshooting Kubernetes, then we can easily wrap around that mechanism. So if teams are using Ansible or Jenkins or scripts hosted on GitHub, the product is designed to wrap around that existing automation. And then the rest of these are a demonstration of using plugins as well. And so in this case, we’re looking at those Cloud Health Events from AWS to see if it was something on their side that caused this alert or not. This is our check to retrieve unhealthy targets behind an Elastic Load Balancer and then posting that data back to PagerDuty, using our out of the box plug in for that. This is where you can see in this case, we hardcoded it so that for each check, this is the team that you should pull in for help if need be. And then what you can see here, it is similar to with PagerDuty, there is a graphical user interface for invoking this this diagnostic, but most of the time these are going to be event driven from PagerDuty or API calls or other tooling integrations.
Jake: So what I’ll quickly do to wrap up the demo, though, is and I had alluded to this earlier, is it’s for us, automating diagnostics is about reducing the number of people involved, but at the same time, it is with this mindset of that end-to-end incident. And so there’s the question of “Now what?” You have the diagnostics and maybe that’s helped you know who to pull in or it’s helped you know if it’s okay to run a band-aid fix to remediate this issue right now here on the fly. And so what you see here from the incident is I can run an action that would be running another automation action. I can change the priority. I can run a new status update, I can pull in more people. But let’s just say I click on “Run an Action” and I can say that I want to maybe rerun the retrieving of diagnostics because I’ve been working on this or I know others have been working on this. And so if I want to get an updated status of these endpoints, I can rerun those diagnostics and that will help me send out a valid status update to stakeholders, maybe update our status page for our customers to see. But then maybe I want to run a resolution and redeploy our service. But cutting a dependency on a third party API that we know we’ve we’ve had trouble having a consistent integration with. So it’s a known band-aid fix that I can run right here from the diagnostics.
Kelly: I like the term “band-aid fix” a lot. “This is temporarily going to get us through this, but we may have to do something else.”
Jake: Yeah, and we all have those as practitioners where we have those Band-Aid fixes, whether it’s just redeploy the pod, even if it’s the same version of the app that we’re redeploying. Maybe it’s a rollback to the prior, the last known healthy version. Maybe it’s a failover or an auto scaling or a rollback or a redeploy. But making those playbooks also securely available to responders is certainly part of the value proposition here. But what I will say, and this is tying everything back together to where we started in terms of “What is automated diagnostics and why?” Why did we start with diagnostics as our foothold into automation, this kind of automation and incident response? And that is that for many teams, remediation is taking action and change in their environment that is a different level of automation. It requires a lot of security review. But above and beyond that, what is clearly known now is that the remediation playbook that works today might not be safe and work tomorrow, and that’s just because of the dynamic nature of environments that people are operating in today.
Kelly: That makes a lot of sense.
Jake: So we’ll go back to the slides. And so this is showing this end-to-end process of what does this look like using Process Automation for automated diagnostics. What we’re showing here is what we were describing in terms of an alert from monitoring will trigger an incident, but that incident is identified through event management, which is the identifying of anomalies, alert grouping, and deduplication, and that can automatically kick off this process automation diagnostic runbook, which automatically goes and queries the tools, infrastructure, and services for the diagnostic data. Again, for the purposes of the demo we showed, invoking it by the click of a button, but in 99% of customer environments, this will be just driven automatically so that when that responder is paged, they already have that context. And then when they have that context, we see the human mobilization part. They know who to call in for help, where to start investigating and debugging, or as shown, maybe there’s an automated band-aid fix that they can run and they know which of those band-aid fixes will most likely at least buy them some time or resolve the issue temporarily.
Kelly: It will get them through the incident at hand at least.
Jake: Exactly. Exactly.
Kelly: Well, great. One last question: What advice or resources would you point folks to who wanted to maybe get started with automating diagnostics?
Jake: So for those that want to get started–assuming you’re a PagerDuty customer already–you can just through the use of automation actions, you can connect up to that open source Rundeck product. And so while it might not have all of the enterprise features of the commercial product, it allows you the same construct, the same framework for from an incident triggering an automated runbook and that automated runbook being able to query your infrastructure, your applications, your monitoring tools. And so that at least gives you the framework upon which you could build into the feature-rich commercial products. We mentioned the blog posts around “What is Automated Diagnostics and Why should you care?” That was the first blog in a three-part series around what is it, what are some common examples of this, and what does PagerDuty provide to those that are that are interested? And on that last piece maybe to wrap up is I’ll say that for those that do engage with the commercial product, we’ve written a handful of out-of-the-box, I don’t want to say templates, but actual examples for if you’re running Redis here is the check that you will run to to confirm whether or not Redis running effectively and for NGINX and for common AWS components. And so we’ve provided that to those who run a trial or sign up for the commercial product to just help them get started and reduce that that time to value.
Kelly: This has been great. I have learned a lot. “Automated diagnostics” was not a term that I just had in my vocabulary prior to talk to you about this. Jake, thank you so much for joining us on the show today.
Jake: Thanks for having me. Pleasure to be here.