Having spent more than a decade seeking to understand developers via the quantitative traces they leave behind in the communities they inhabit and the tools they choose, the time has come to do the same with agents: introducing the first edition of the RedMonk Agent Activity Index.
For over fifteen years, RedMonk has been tracking the relative performance and popularity of programming languages within two datasets: GitHub and Stack Overflow. We replicated a study originally performed by Drew Conway and John Myles White and then repeated it at regular intervals, which offered the ability to not only evaluate a snapshot of a given period, but to monitor shifts and trends within programming language usage over time. The sources for both of the axes for our study have degraded over time, and while it’s not strictly because of agents, they are a major factor.
The monumental impact of coding assist agents has led to a fundamental rethinking of RedMonk’s programming language rankings, which we’ll have more details on within the next few weeks.
While we were looking at the data and attempting to evaluate that impact quantitatively, however, it became apparent that in addition to tracking the relative performance of programming languages that there were some interesting quantitative insights to be found about the agents themselves. As with the language rankings, there are many caveats and much that remains opaque quantitatively about agents, but there is a great deal about agent usage, traction and patterns that can be usefully studied. Their popularity relative to one another; variations in usage amongst specific programming language communities; and even whether they’re permitted to be used at all. And much like the rankings, we’re interested in what the current snapshot tells us, but we’re even more interested to see how this data changes over time.
While we’ve looked at agent activity within specific projects as well as wider communities, this is our first attempt to understand these new New Kingmakers in a broader context.
Before we get into the charts, a few important caveats:
- Different agents leave different fingerprints, and some leave none at all. All that we can reliably establish, then, is a usage floor. We cannot measure the ceiling.
- Tools that leave footprints will be over-represented in this sample; tools that leave no trace conversely will be under-represented or not counted. As will be unreported coding assistance by humans.
- Different version control sites or forges are a challenge to measure relative to one another. First, for obvious sample size considerations, but also because API access and transparency is not consistent from forge to forge. Some could not be queried at all. Several charts in this analysis, therefore, are GitHub-only both because it’s the largest sample but also because its API offers some of the best visibility.
With that, let’s get into the index.
Top Level Takeaways:
- Agent Traction: Across a thirty language sample – the top twenty by PRs and another ten selected for their significance – agents opened 13.9M of 45.4M pull requests on GitHub in Q3, or 30.5%. GitHub’s own figure for September was over 40%, up from 17% in March. There are a few reasons for the disparity: GitHub’s numbers include public and private repos, ours can only survey public. Their figure was for September only, ours was a three month sample, and GitHub has inside access to PR-creation while we’re restricted to public fingerprints. Ultimately, both the findings here and those from GitHub’s Octoverse are consistent with a market in which agent traction is accelerating.
- Claude Code Usage: As has already been discussed, the challenges involved in measuring agent traction are many. Some tools are particularly underrepresented, but every agent in this survey likely had some usage uncaptured. There are undoubtedly selection and sample biases potentially in play as well. Even with those caveats, however, Claude Code’s performance in this survey stands out. AI tooling moves so quickly that it can seem like a flashy new tool arrives every month or even every week. Be that as it may, Claude Code’s overwhelming popularity in this index is indicative of a tool which has not only been popular to this point, but seems to still be growing.
- AI Acceptance: The acceptance of AI generated or advised code will vary, naturally, across an industry of near infinite variety. Open source, as has been documented, appears to adopting AI-authored code very slowly, and the obvious question was whether that was consistent with the wider industry around it or whether open source was more skeptical than the wider world. The indications herein are that it’s the latter; amongst the sample of projects that have some sort of AI policy in place, a clear majority permit AI in at least some capacity.
- AGENTS.md: While this analysis can only scan for the presence of an AGENTS.md file, not actual use of it, the emergence of a multi-vendor standard in this space rather than fragmented, vendor-specific configuration mechanisms is a development which in turn could impact the potential switching costs of moving from platform to platform. This trend will be important to watch over time to see if it is ultimately cemented as a standard or whether vendors chip away with specialized configuration mechanisms in an attempt to deter movement.
- Agent Consolidation: A detailed, in depth evaluation of the agent market is not in scope for this index, but the findings here allow for the possibility of consolidation in that space. The observable traction here is unevenly distributed and tends to be concentrated in a few players; further analysis will be required to render a more accurate assessment on the possibility of agent consolidation.
To explore those and other themes in more detail, we’ll begin with language trends.
Pull Requests by Language
One of the more interesting questions is whether there might be disparities in agent usage by language – are some communities more or less willing to employ agents to write code? Or conversely, are agents more likely to write in some languages over others?
While we obviously can’t infer intent at scale and there are many factors that could be at work – languages being disproportionately used for agent-friendly tasks, repository language classification issues, etc – the following is a chart that captures the agent-attributed share of pull requests by language for the third quarter of 2026. It’s not the top 100 languages our language rankings are based off of, but the Top 20 languages by PR volume on GitHub.
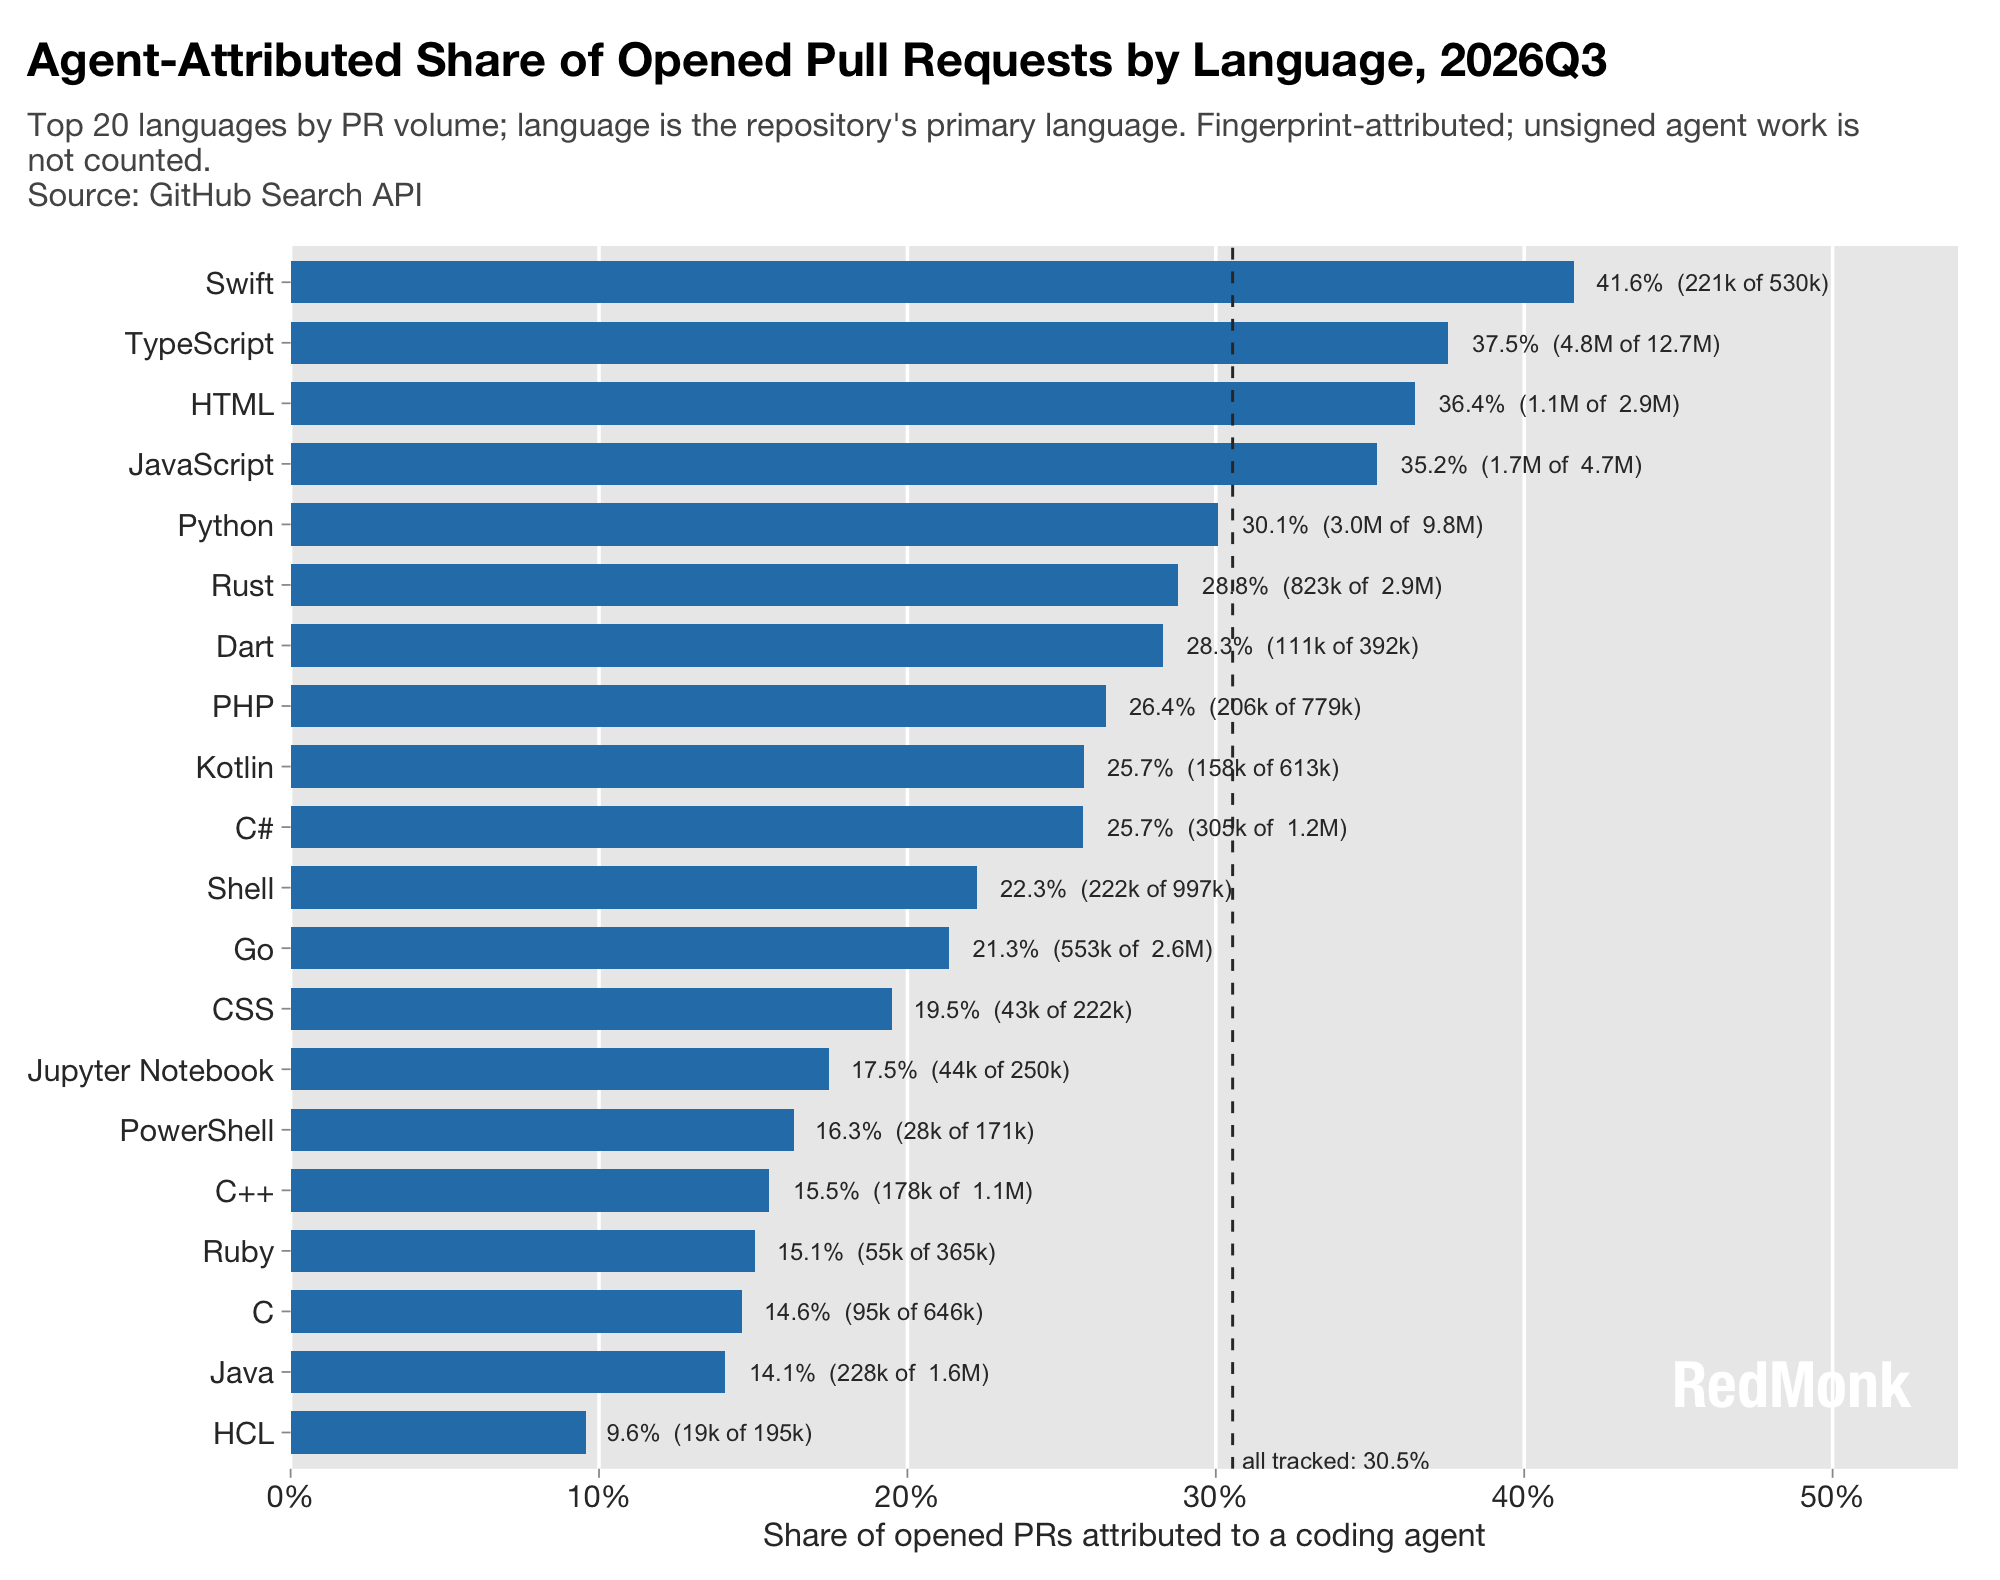
Swift’s outperformance at the top of this chart is a mild surprise and will require further, more detailed investigation to see if that’s an artifact of language usage, large repositories, smaller sample size or some other factor. The popularity of TypeScript, JavaScript and Python, on the other hand, is expected. Of the others, Rust’s relatively high placement and Java’s comparatively lower positioning are notable.
Pull Requests and Commits by Agent
Another common question regarding agents is how popular they are individually. As a reminder, agents that don’t leave an imprint on the PR (app author, body footer or branch prefix) are not counted, which is why Antigravity, Cline, Windsurf et al are essentially invisible here. It’s also important to remember that this analysis cannot reliably distinguish false positives (agents preparing PRs from human written code) or negatives (humans manually submitted agent-written code). With those caveats in mind, here’s the chart.
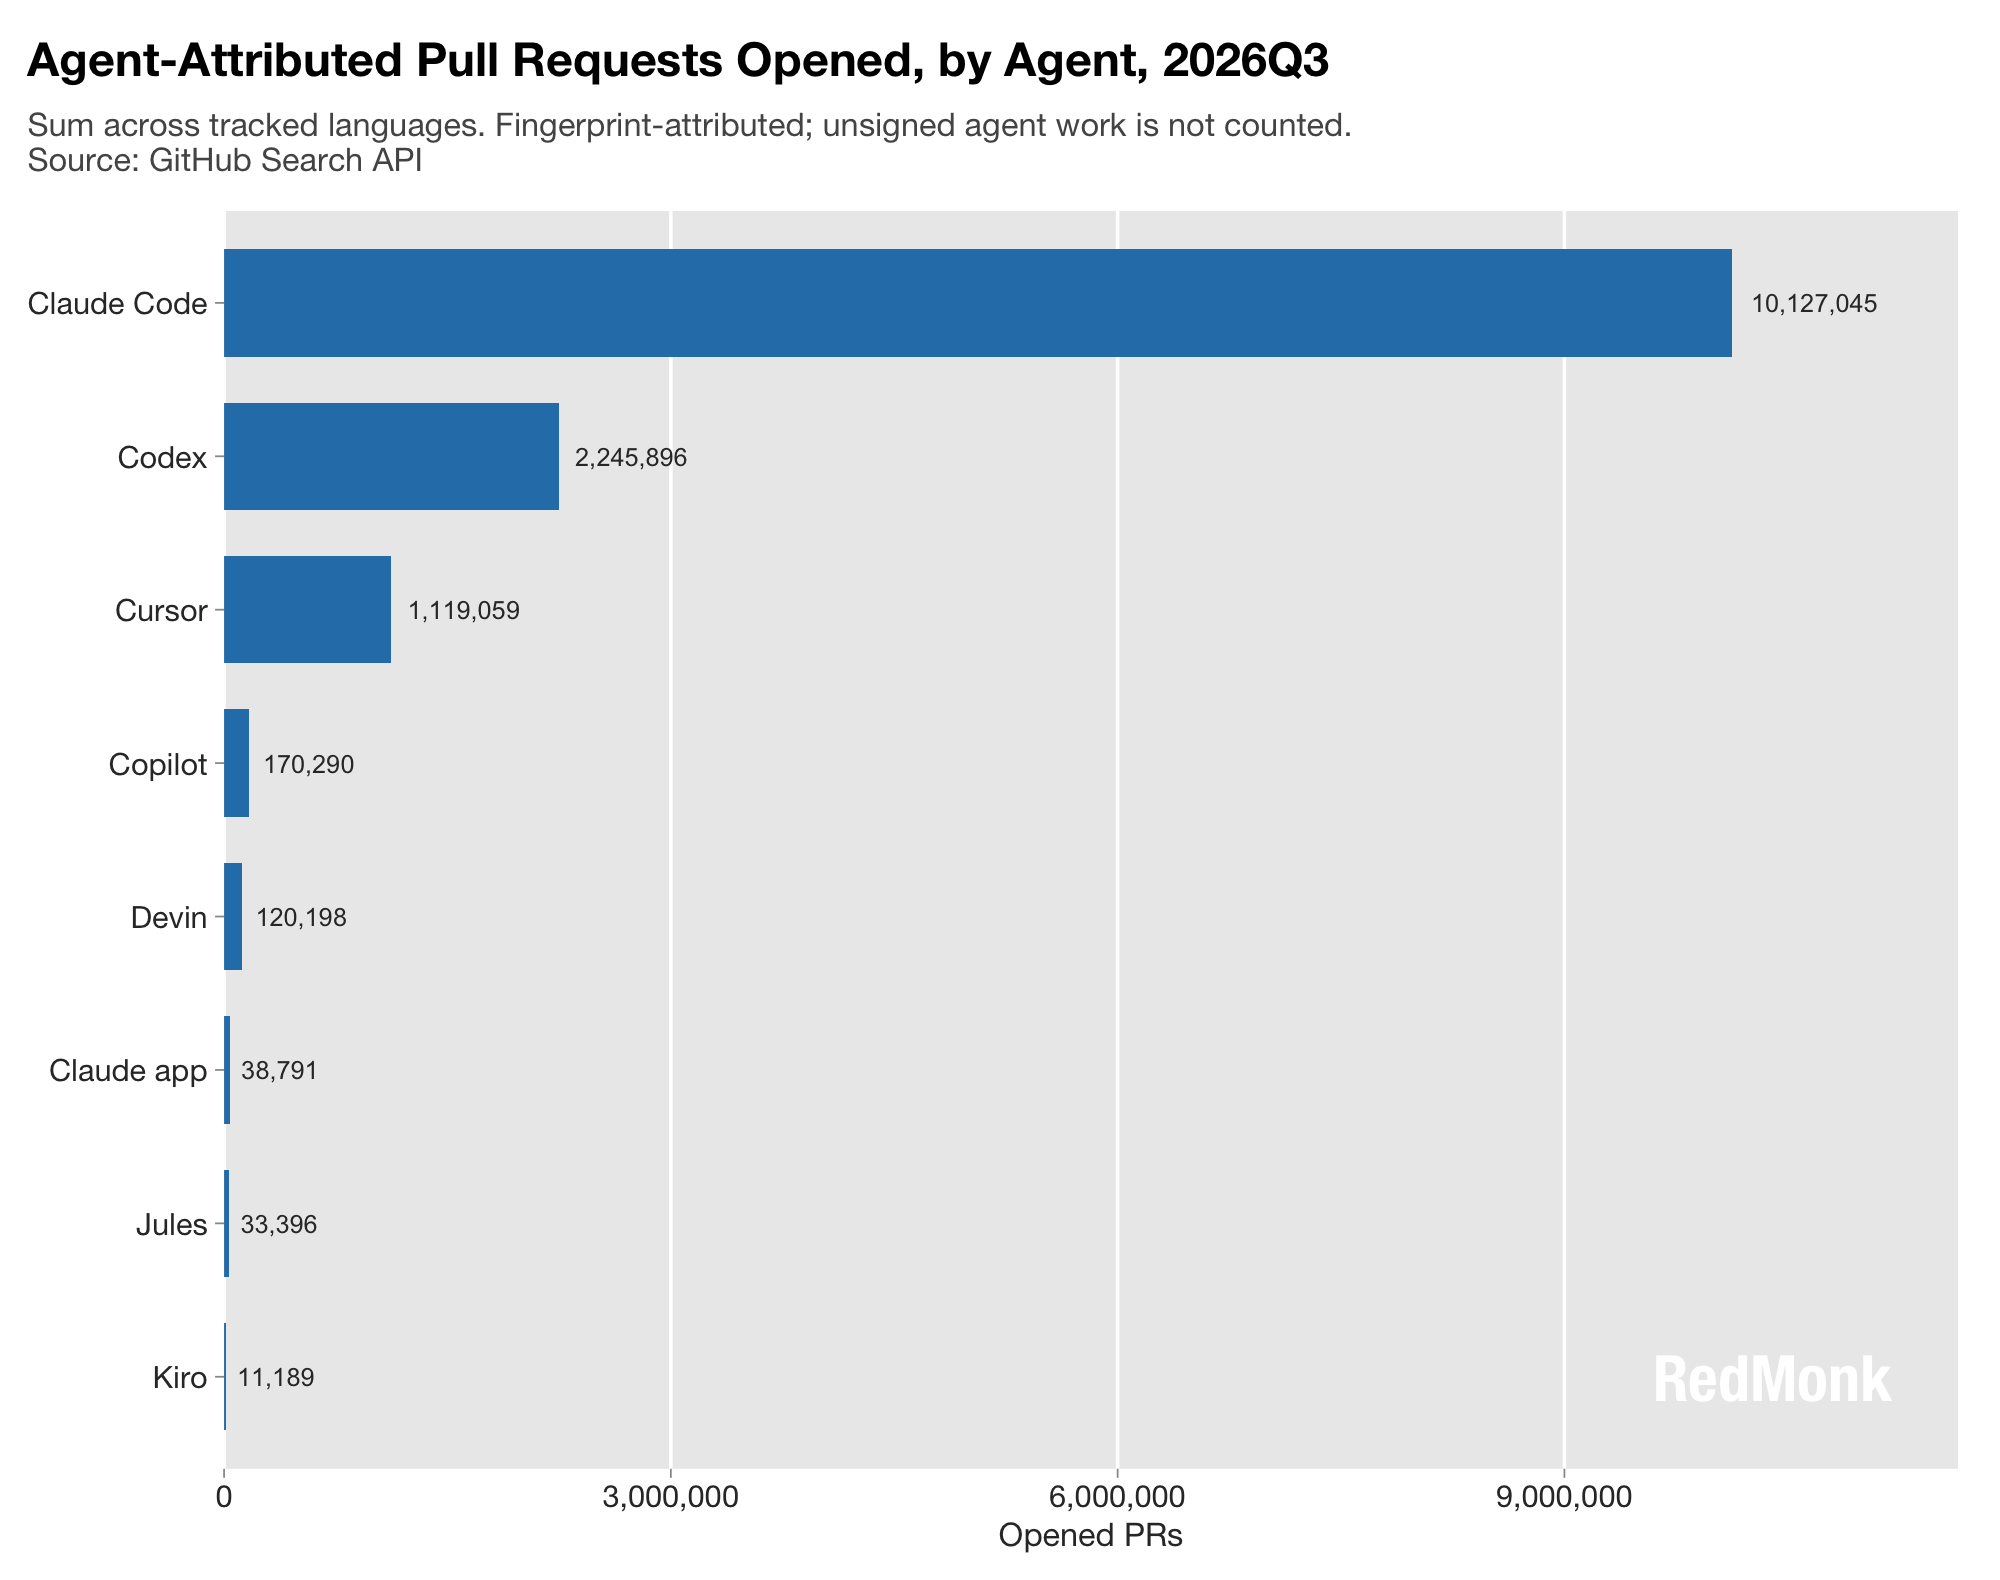
Among tools that leave fingerprints on PRs, however, there’s Claude Code and then there’s everything else – at least within the confines of GitHub’s dataset. From what we gathered at GitHub Universe, as well, that was consistent with the company’s experience.
While some of the missing tools don’t leave marks on the PR, however, several do add Co-authored-by trailers to commit messages which are searchable. This paints a more complete picture.
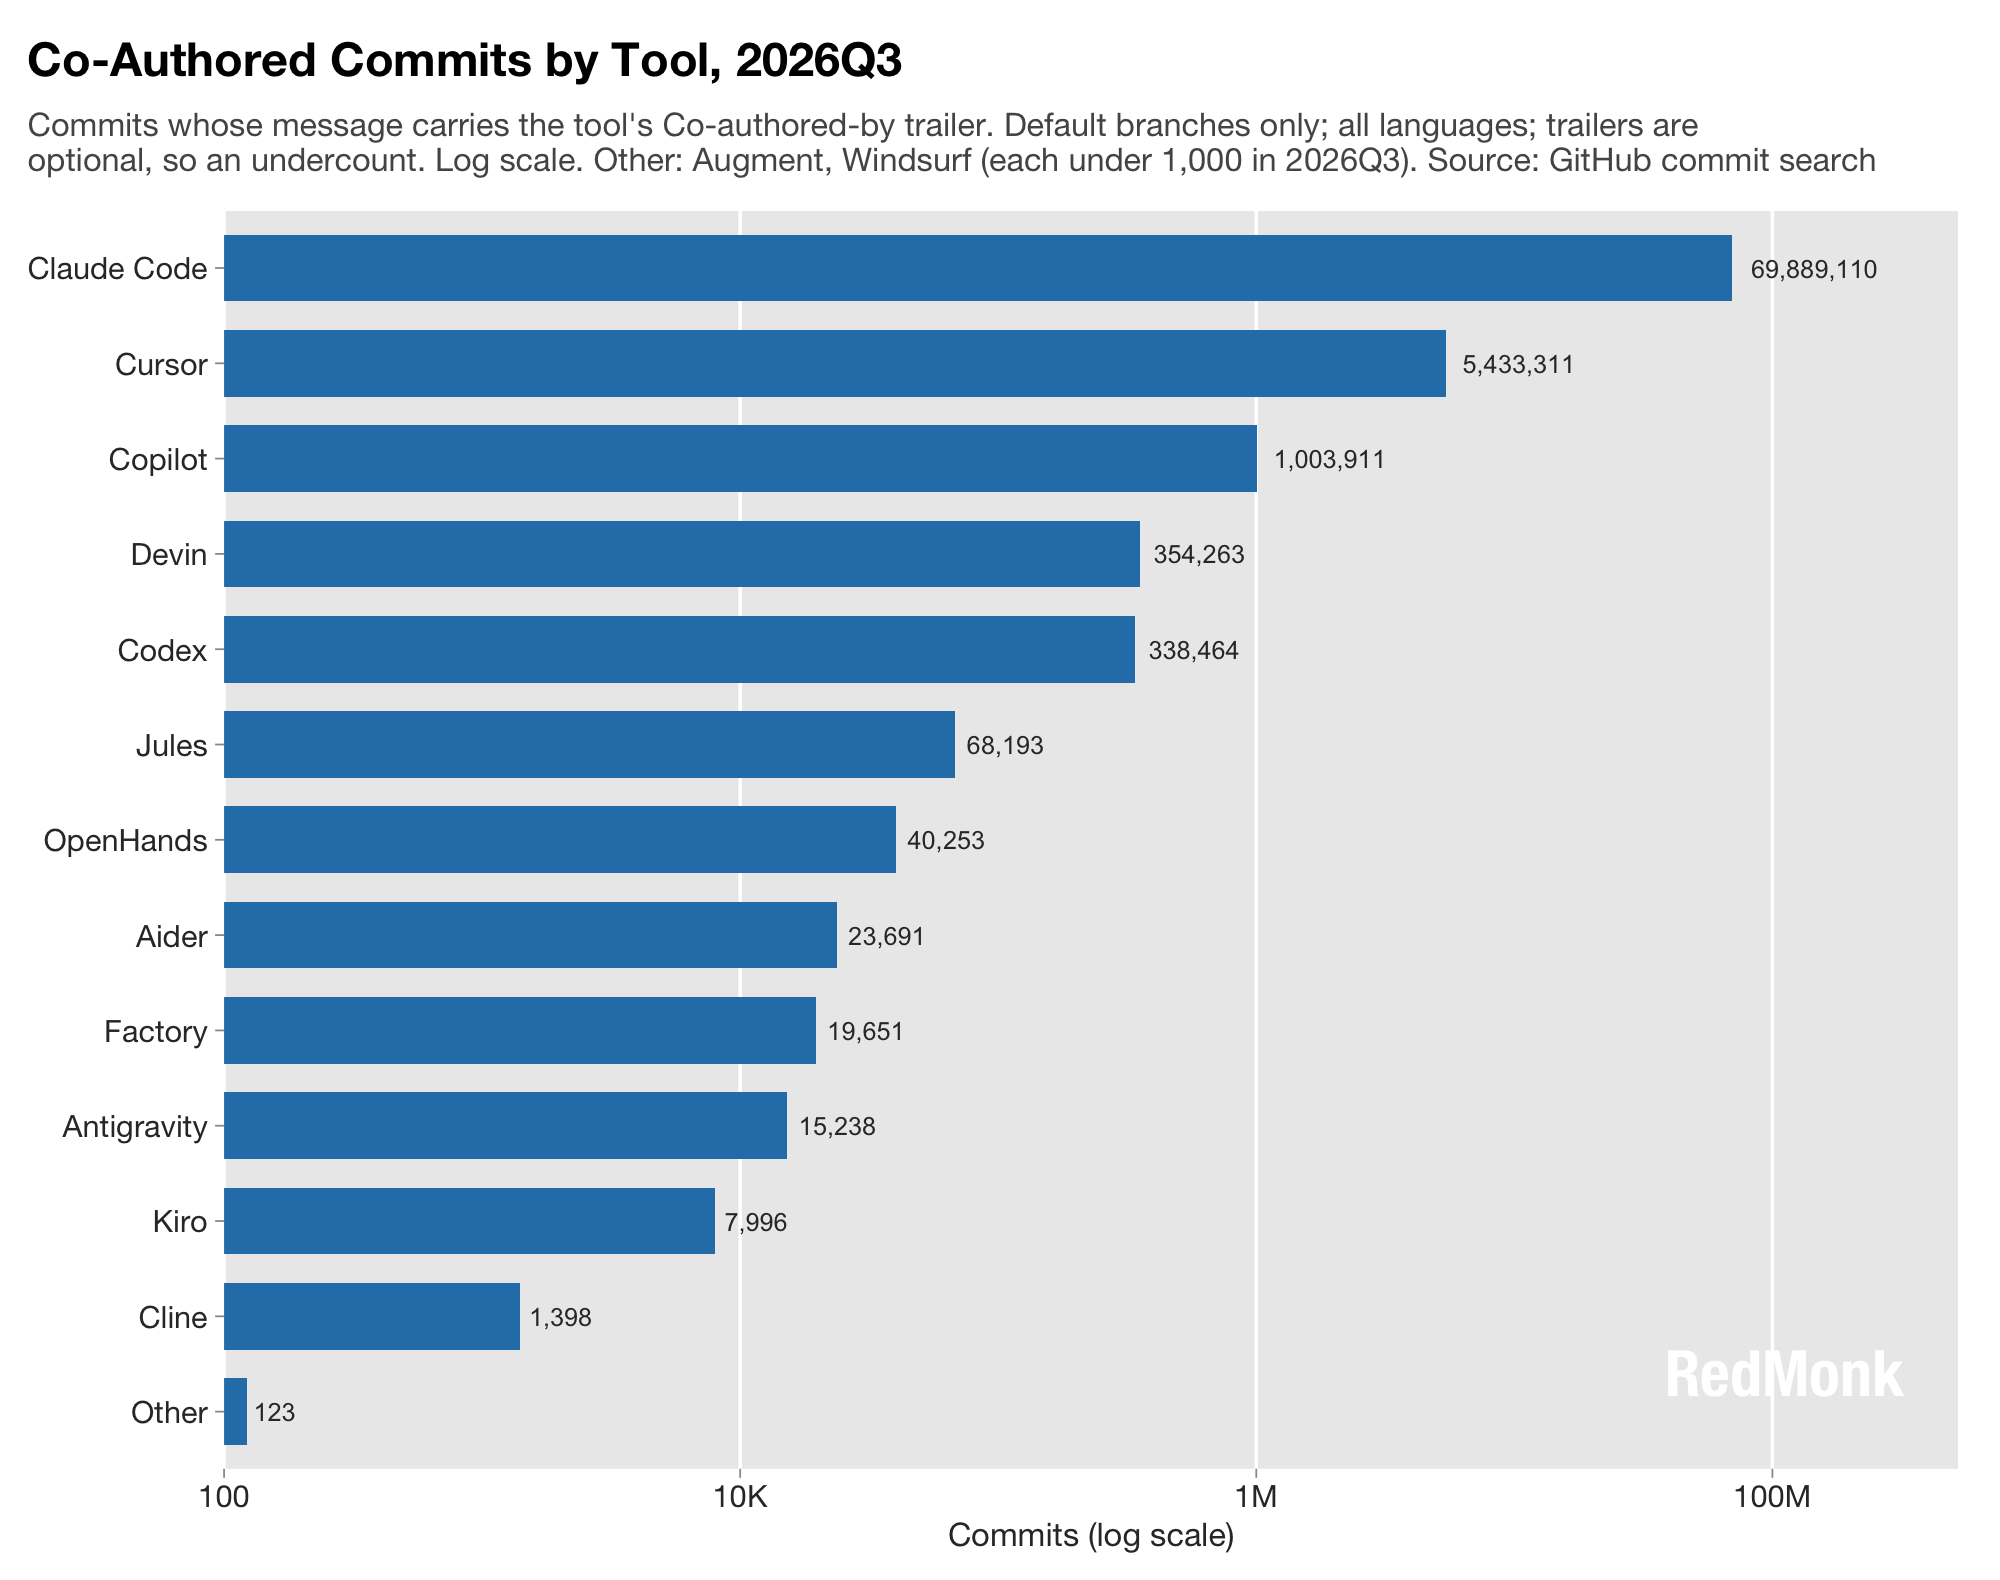
This is what the landscape looks like when we search more broadly. It’s using log scale, notably, given Claude Code’s sheer volume.
Merge Rates by Agent
Pull requests are one way to measure agent traction, but it’s also useful to look at the percentage of those pull requests that are being merged. Note that the sample sizes differ from the chart above because that is all PRs while these count only decided PRs (merged or closed), with still-open PRs excluded. Additionally, it’s important to note that there could be selection biases (e.g. agents might be tasked with quick easy tasks), over/underrepresentation (e.g. many factors can impact the likelihood that a PR is merged) and a variety of other factors that might impact the data. Even taking the percentages below with a grain of salt, however, the patterns are worth examination.
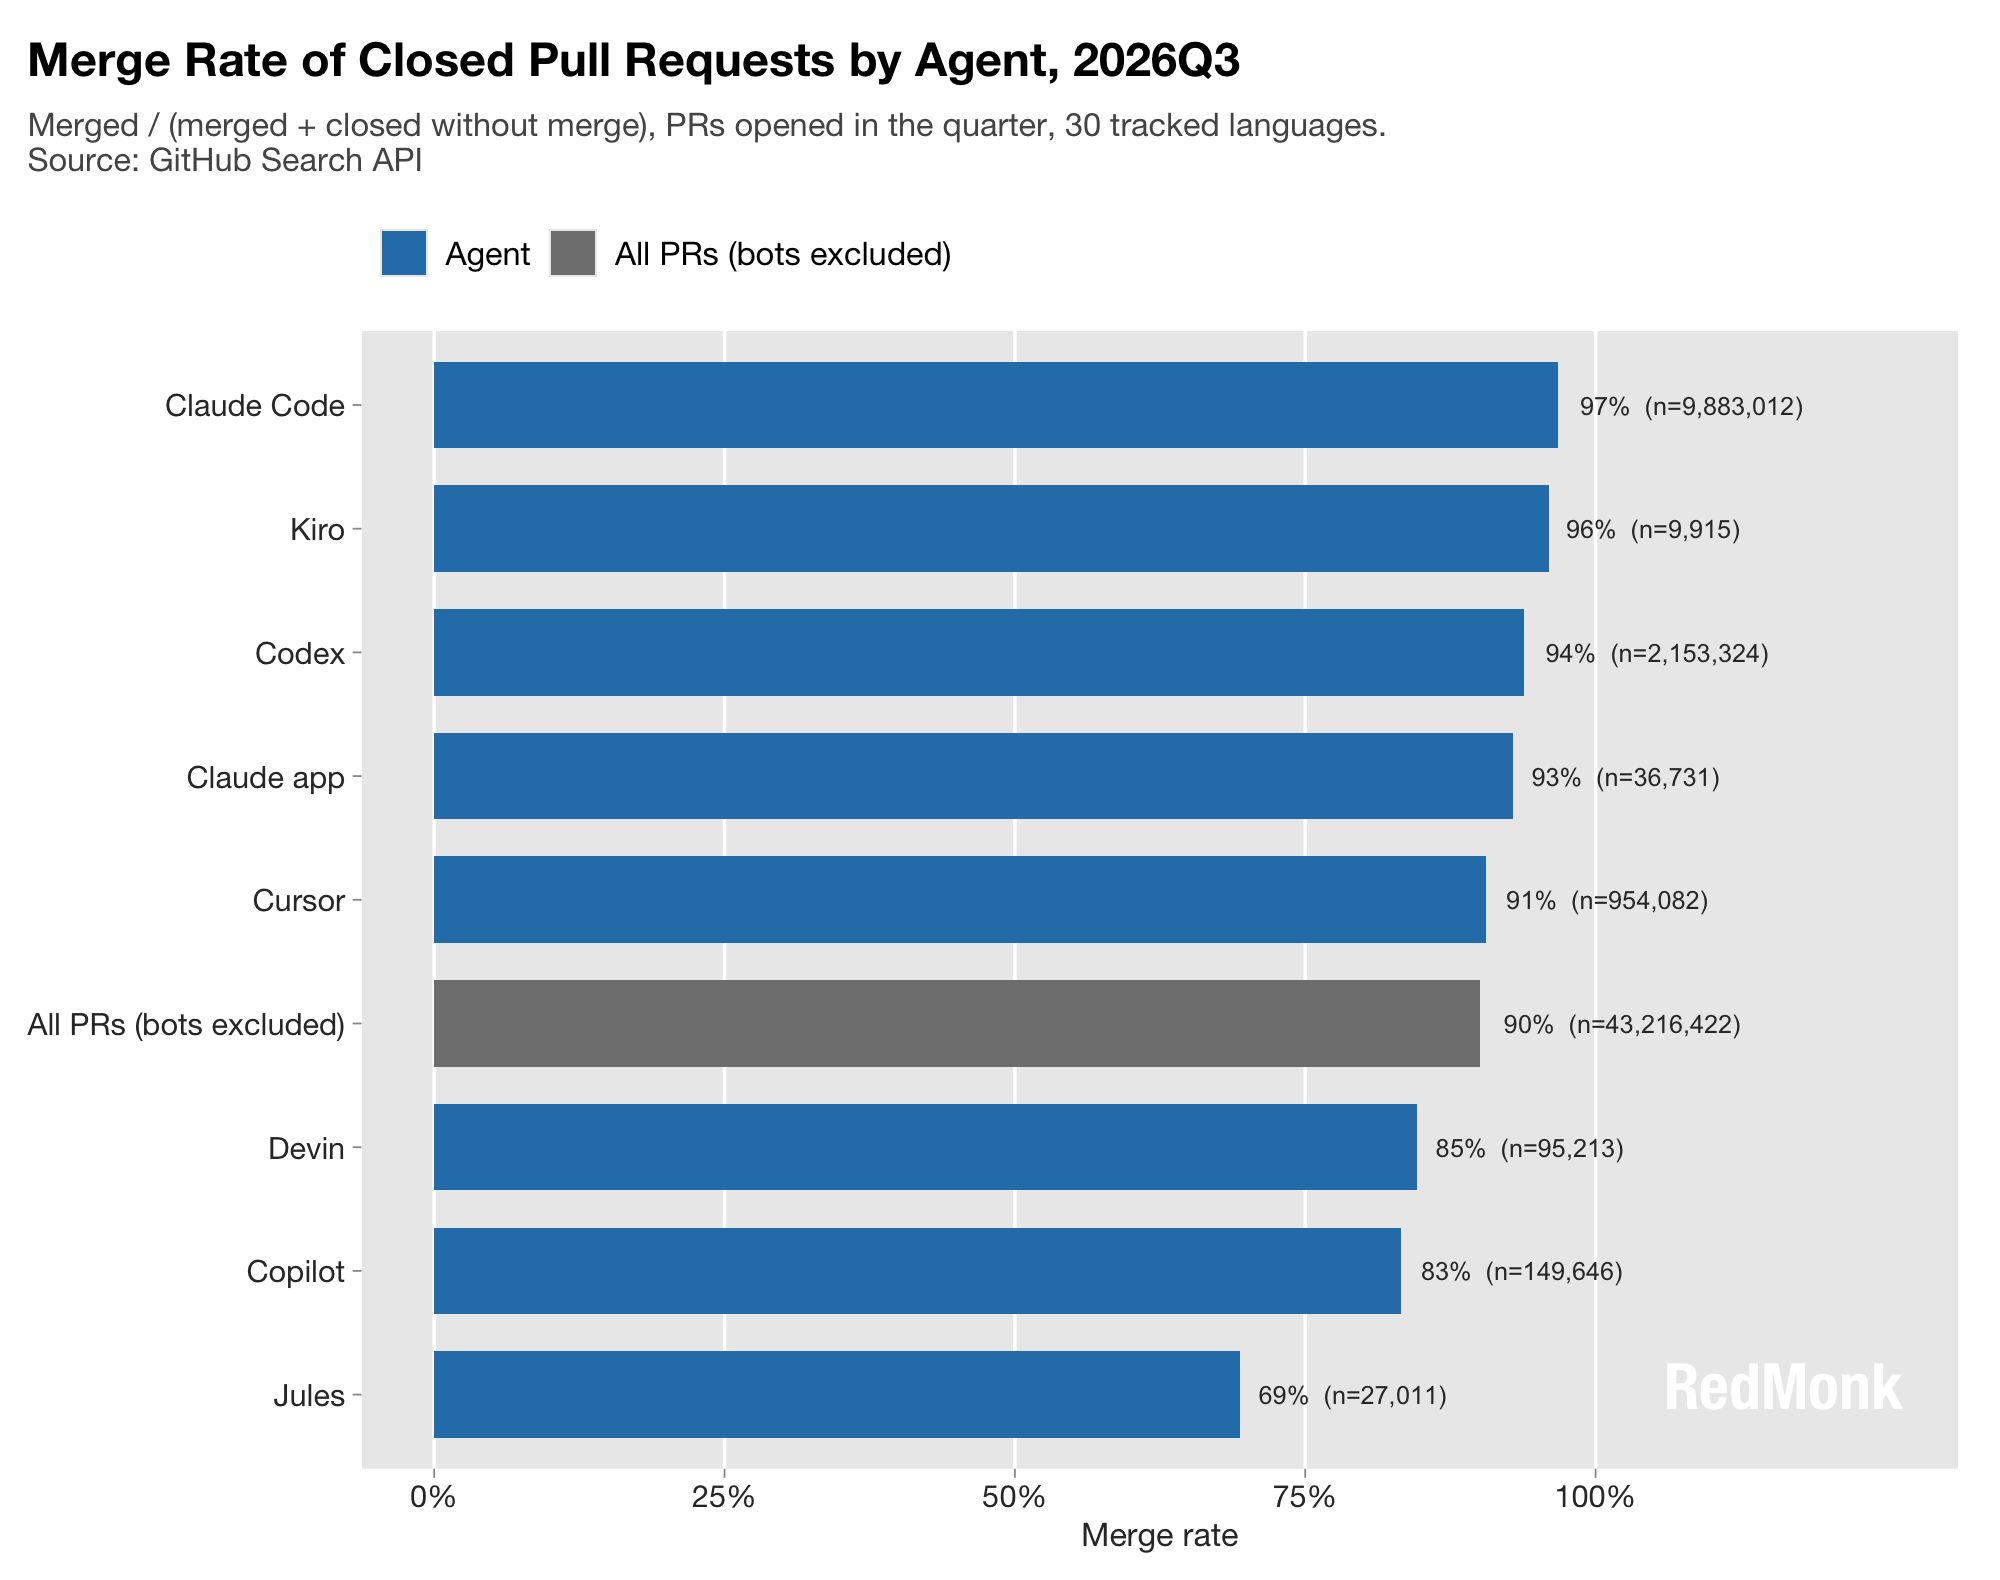
Claude Code outperforms here, as above, but Kiro’s second place finish is interesting. The recently sunsetted Jules, meanwhile, showed the worst merge rate tracked here, which is perhaps unsurprising given the original autonomous nature and the fact that the tool has been deprecated.
If we expand our scope beyond just the PRs that were merged or closed without a merge to include those still active, however, the numbers look slightly different.
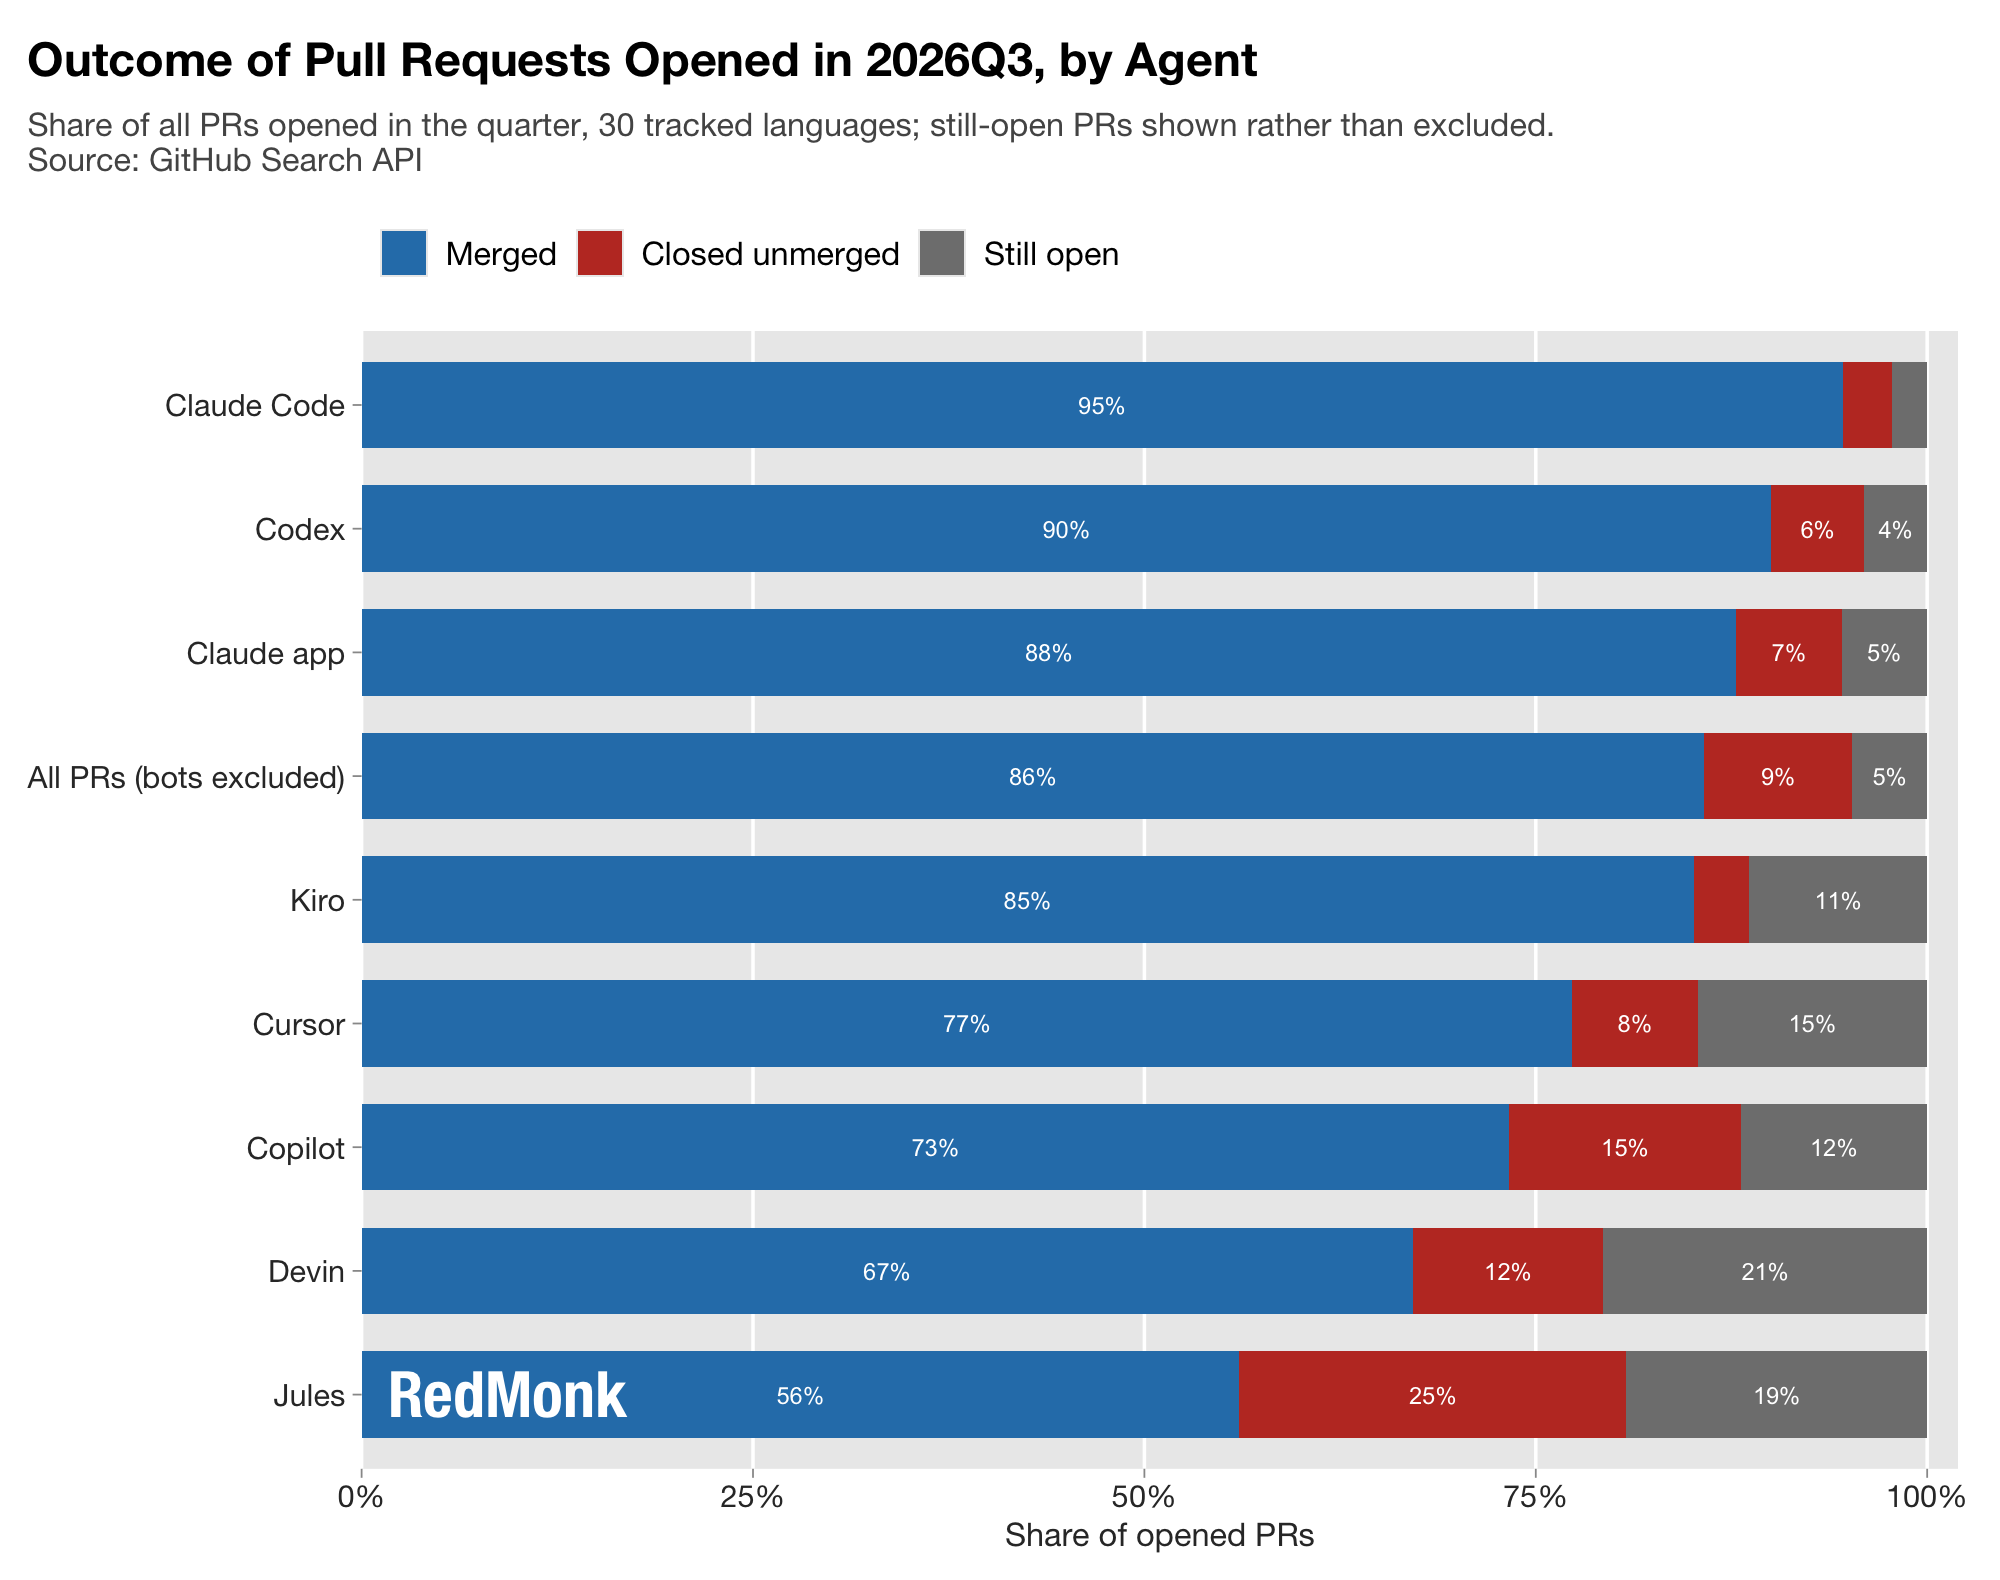
Kiro’s decidedly larger share of undecided PRs drags down its performance by one tier.
Agent Instruction File Paths on GitHub
Where it was once common to have agent instructions laid out in a custom format, the industry has gradually consolidated around the AGENTS.md file as a standard.
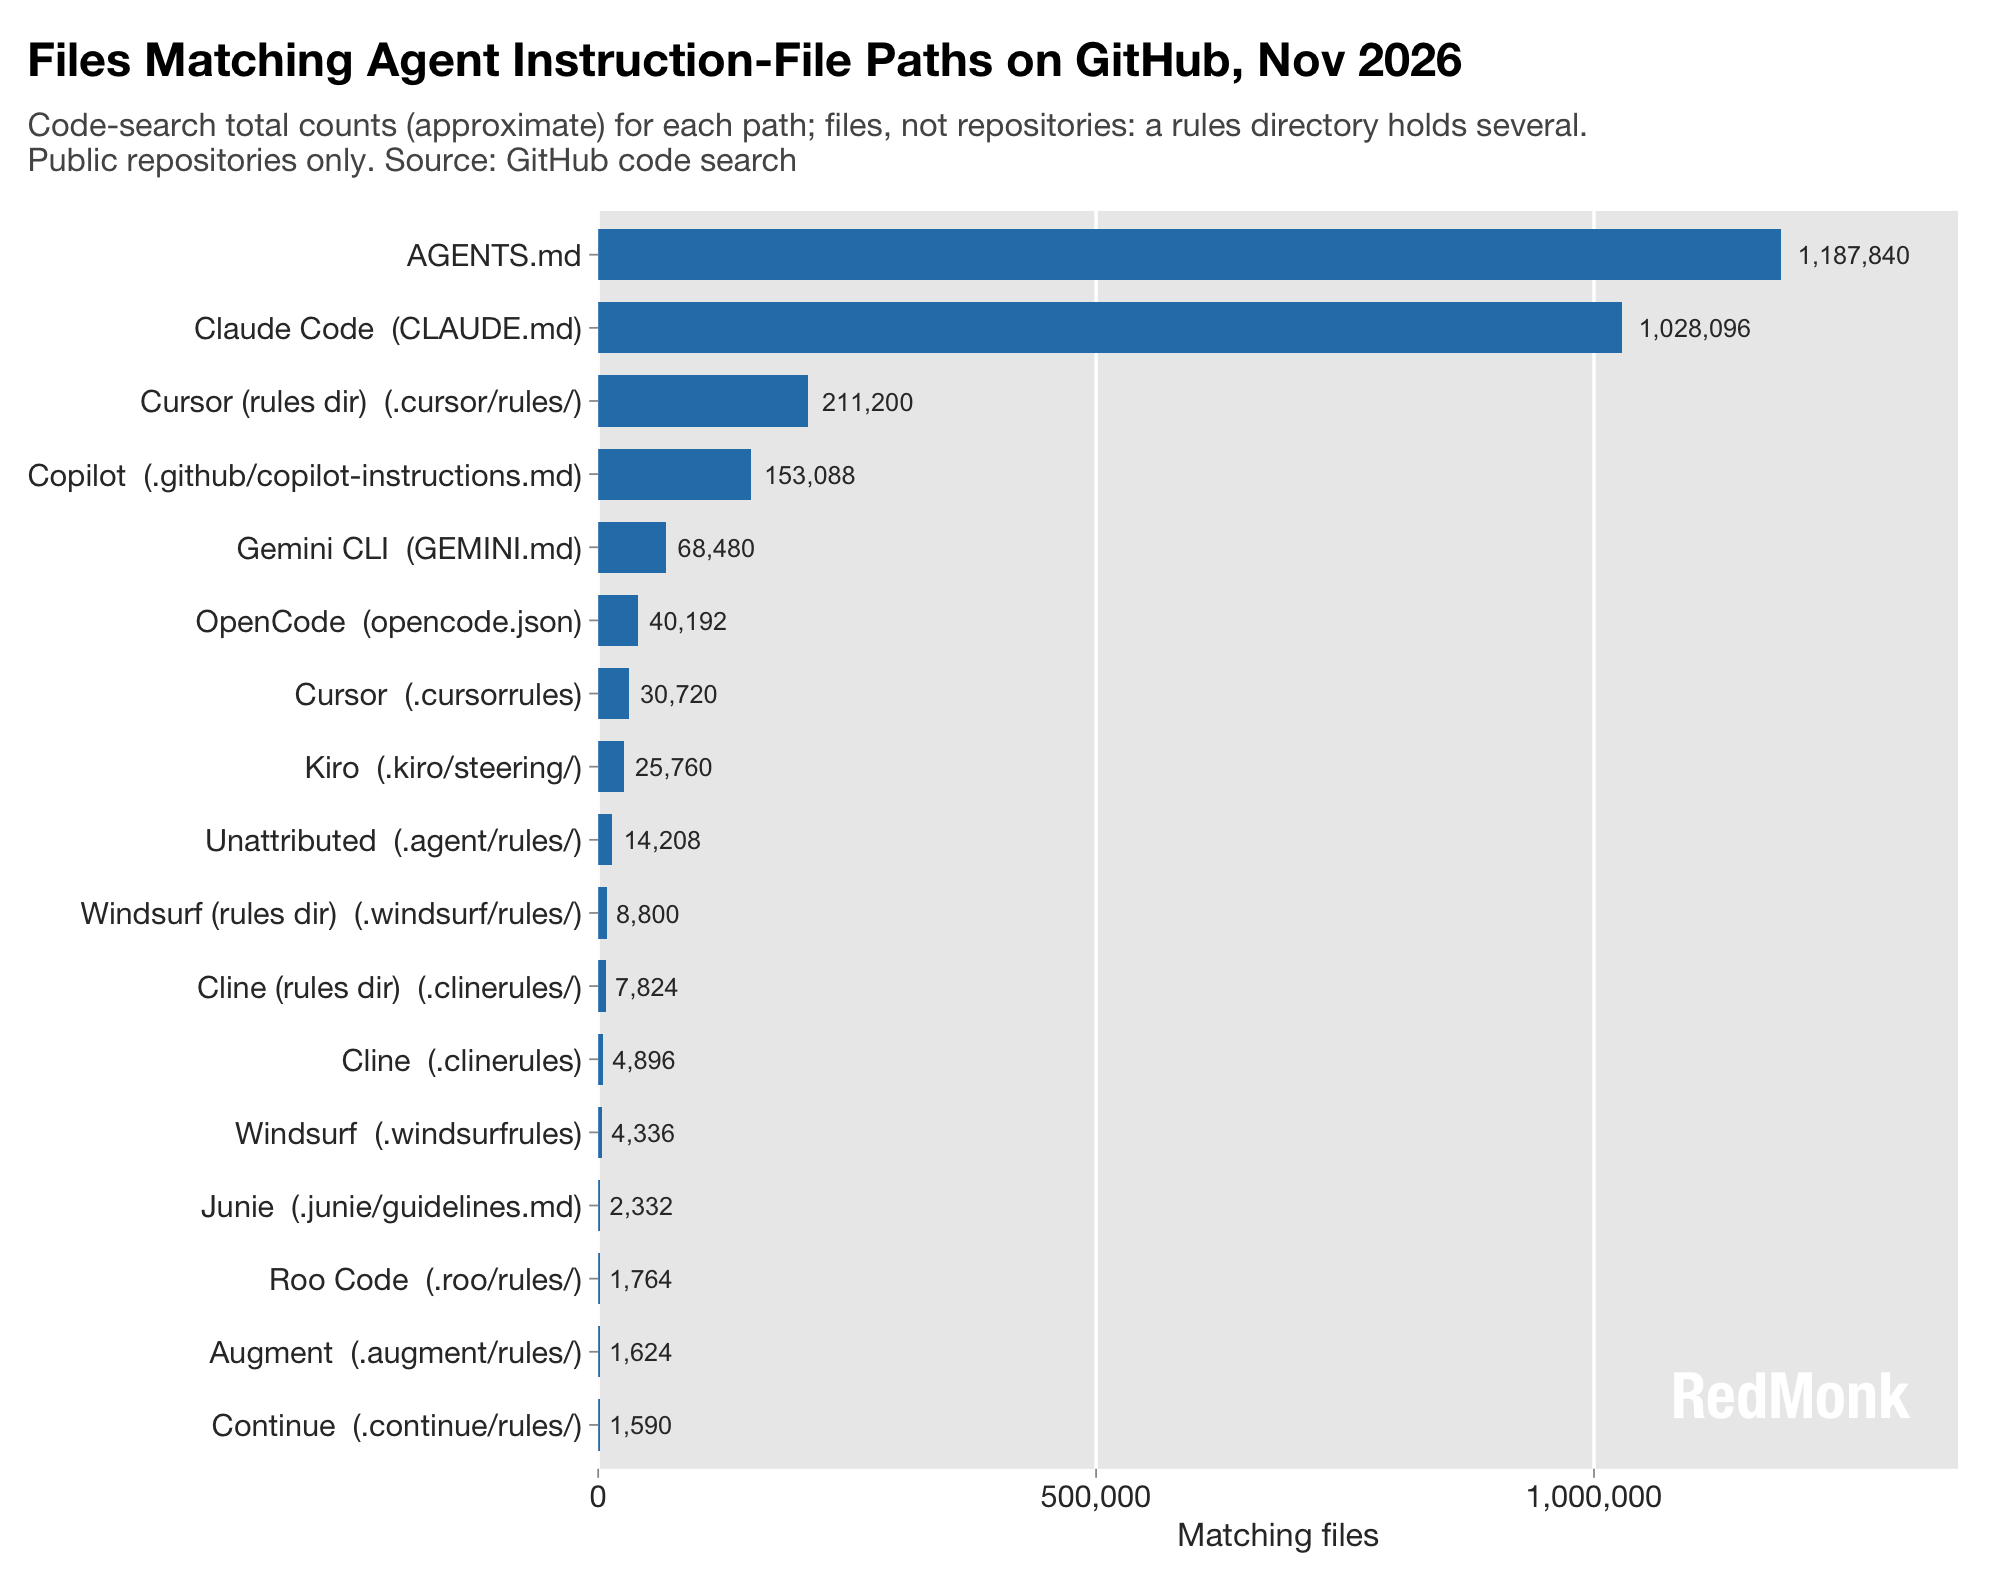
The data reflects this shift, and it’s reasonable to expect the standard’s lead to widen over time.
Speaking of agent instruction files, here is a breakdown of the primary languages in repositories carrying each of those instruction files.
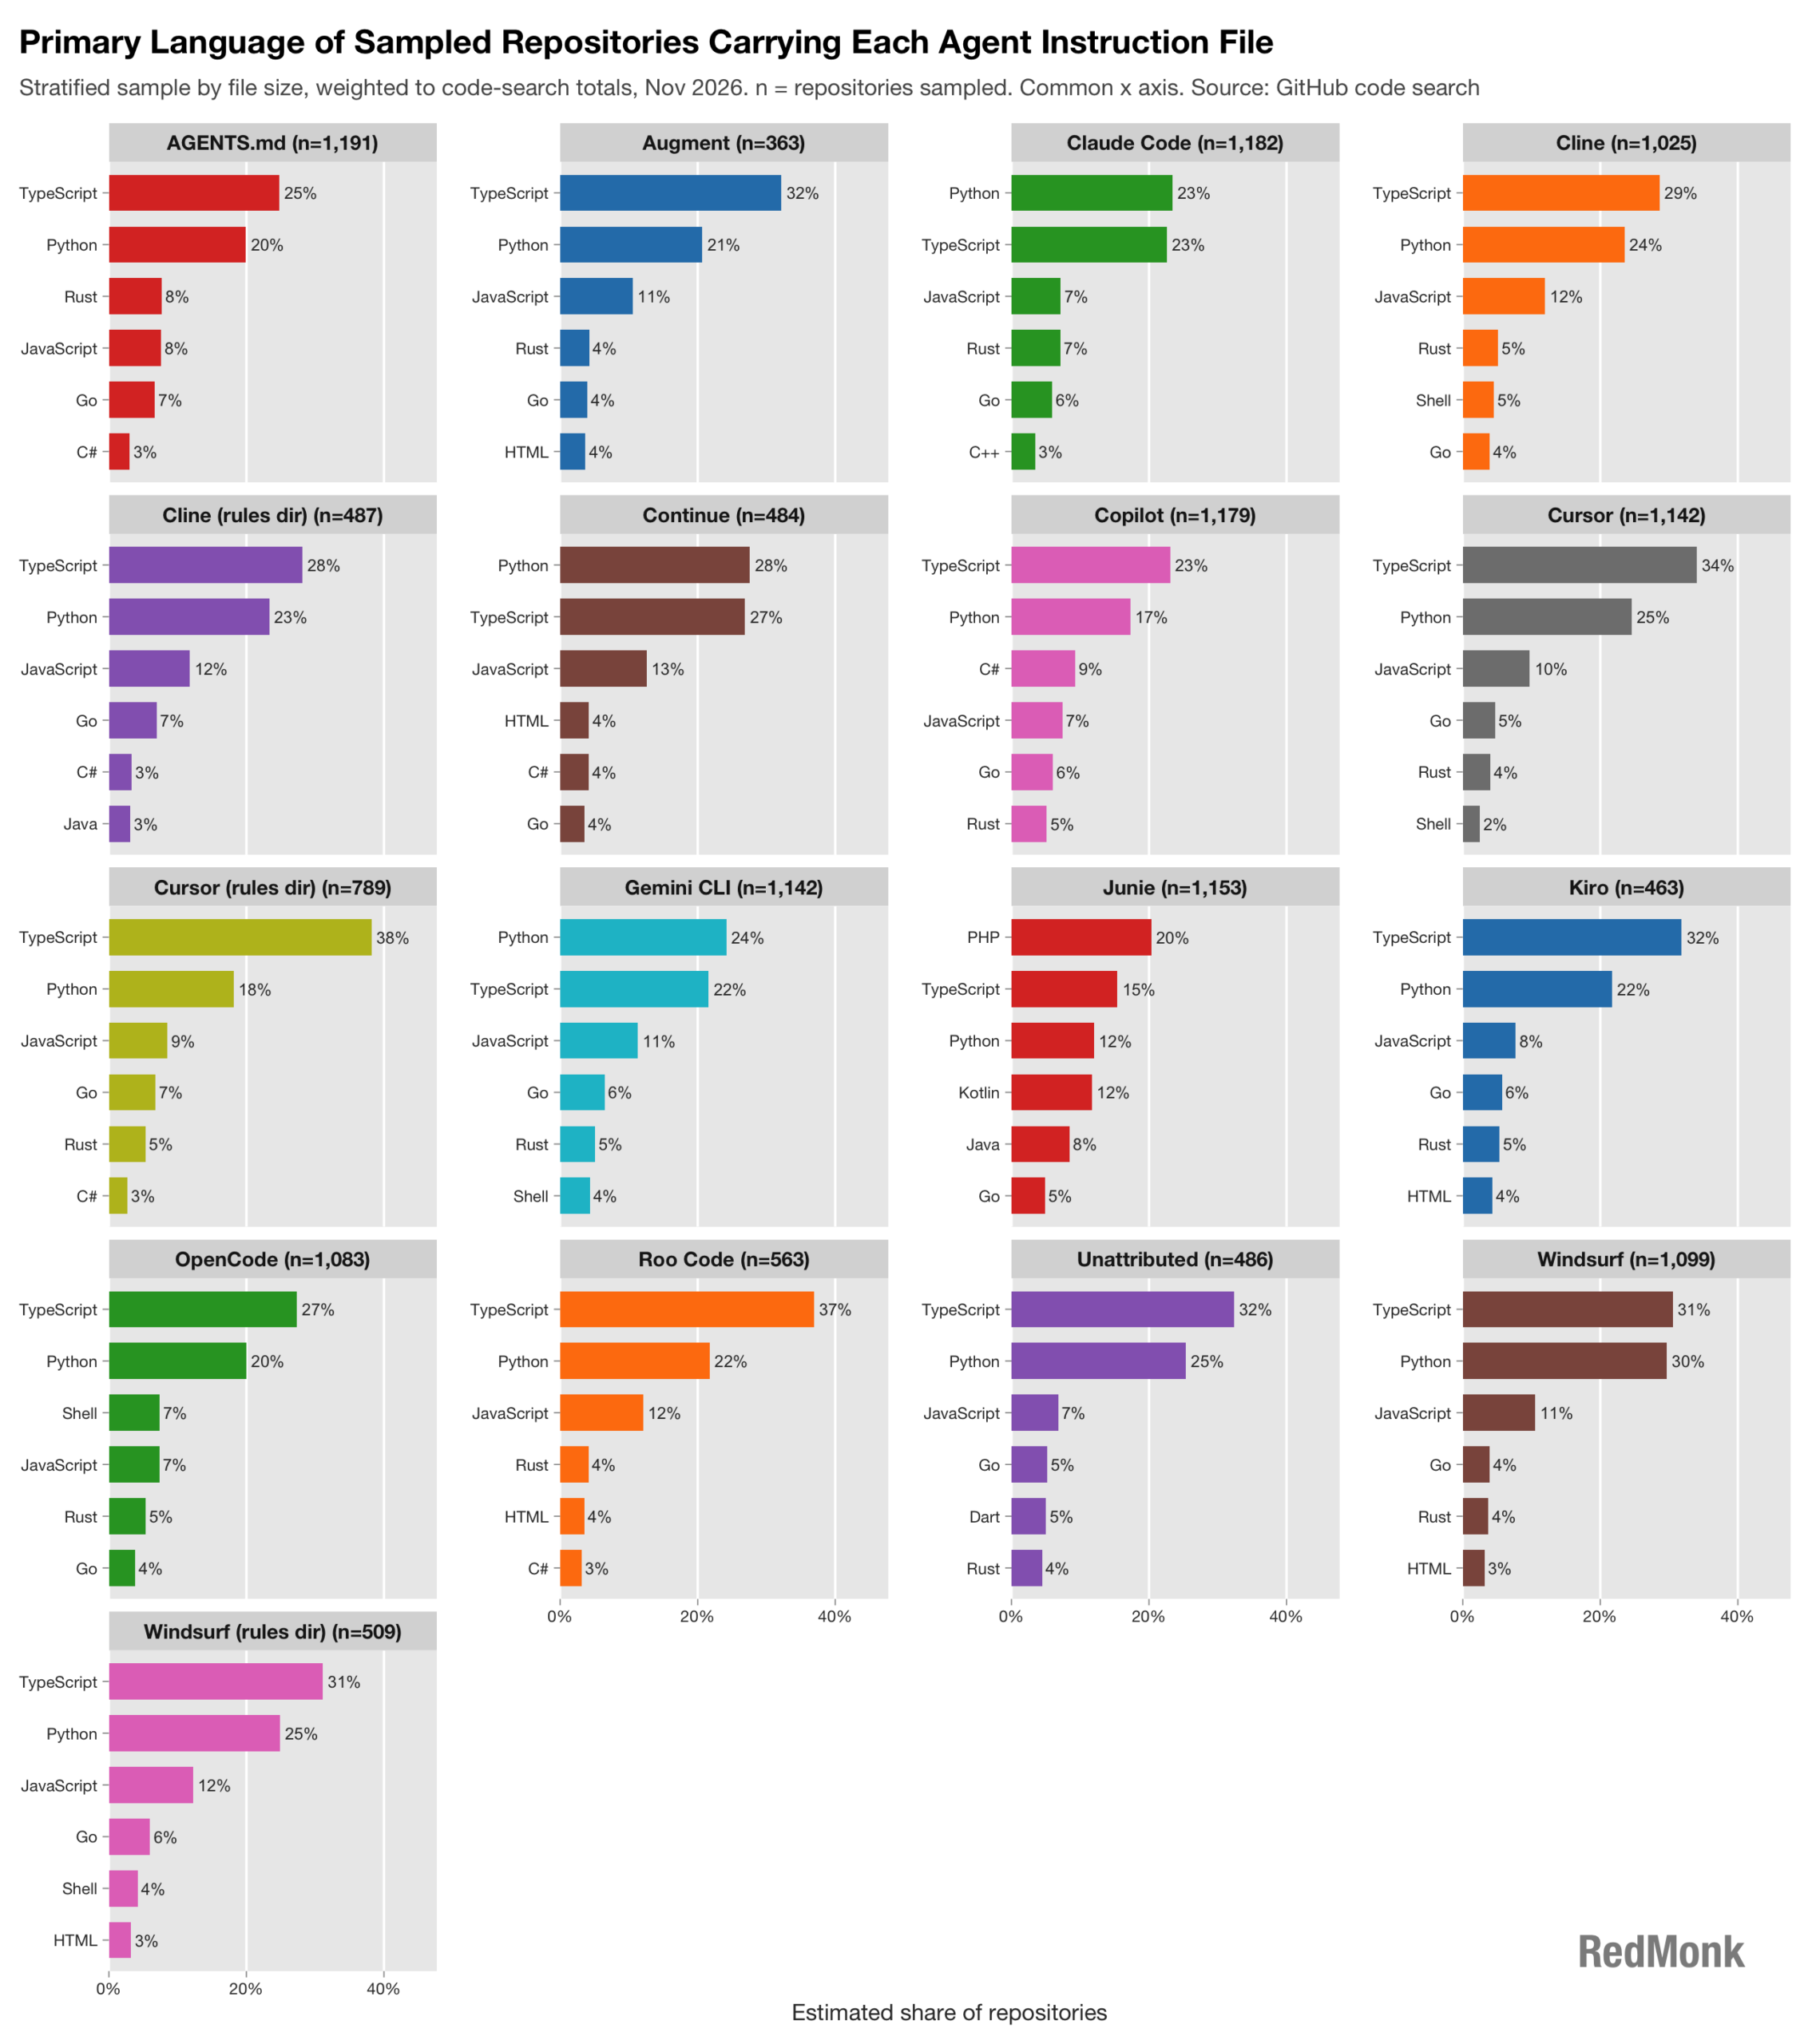
TypeScript, Python and JavaScript dominate as expected, and there are a couple of organization specific results that could be predicted: Gemini’s preference for Python, for example, or Copilot’s comparatively high positioning for C#. Java, meanwhile, is top 6 only within Cline and Junie datasets.
Package Repository Agent Downloads
Turning to npm and PyPi stats next, this measures weekly downloads from those package repositories. One important caveat: because Antigravity, Cursor, Kiro and others ship as installers they are not counted in this chart. It also filters tools that aren’t generating 100K downloads per week over the last month. The second notable caveat is that there were two highly anomalous spikes in downloads for the Codex CLI and one for Copilot CLI that were presumed to be artifacts and are thus excluded here.
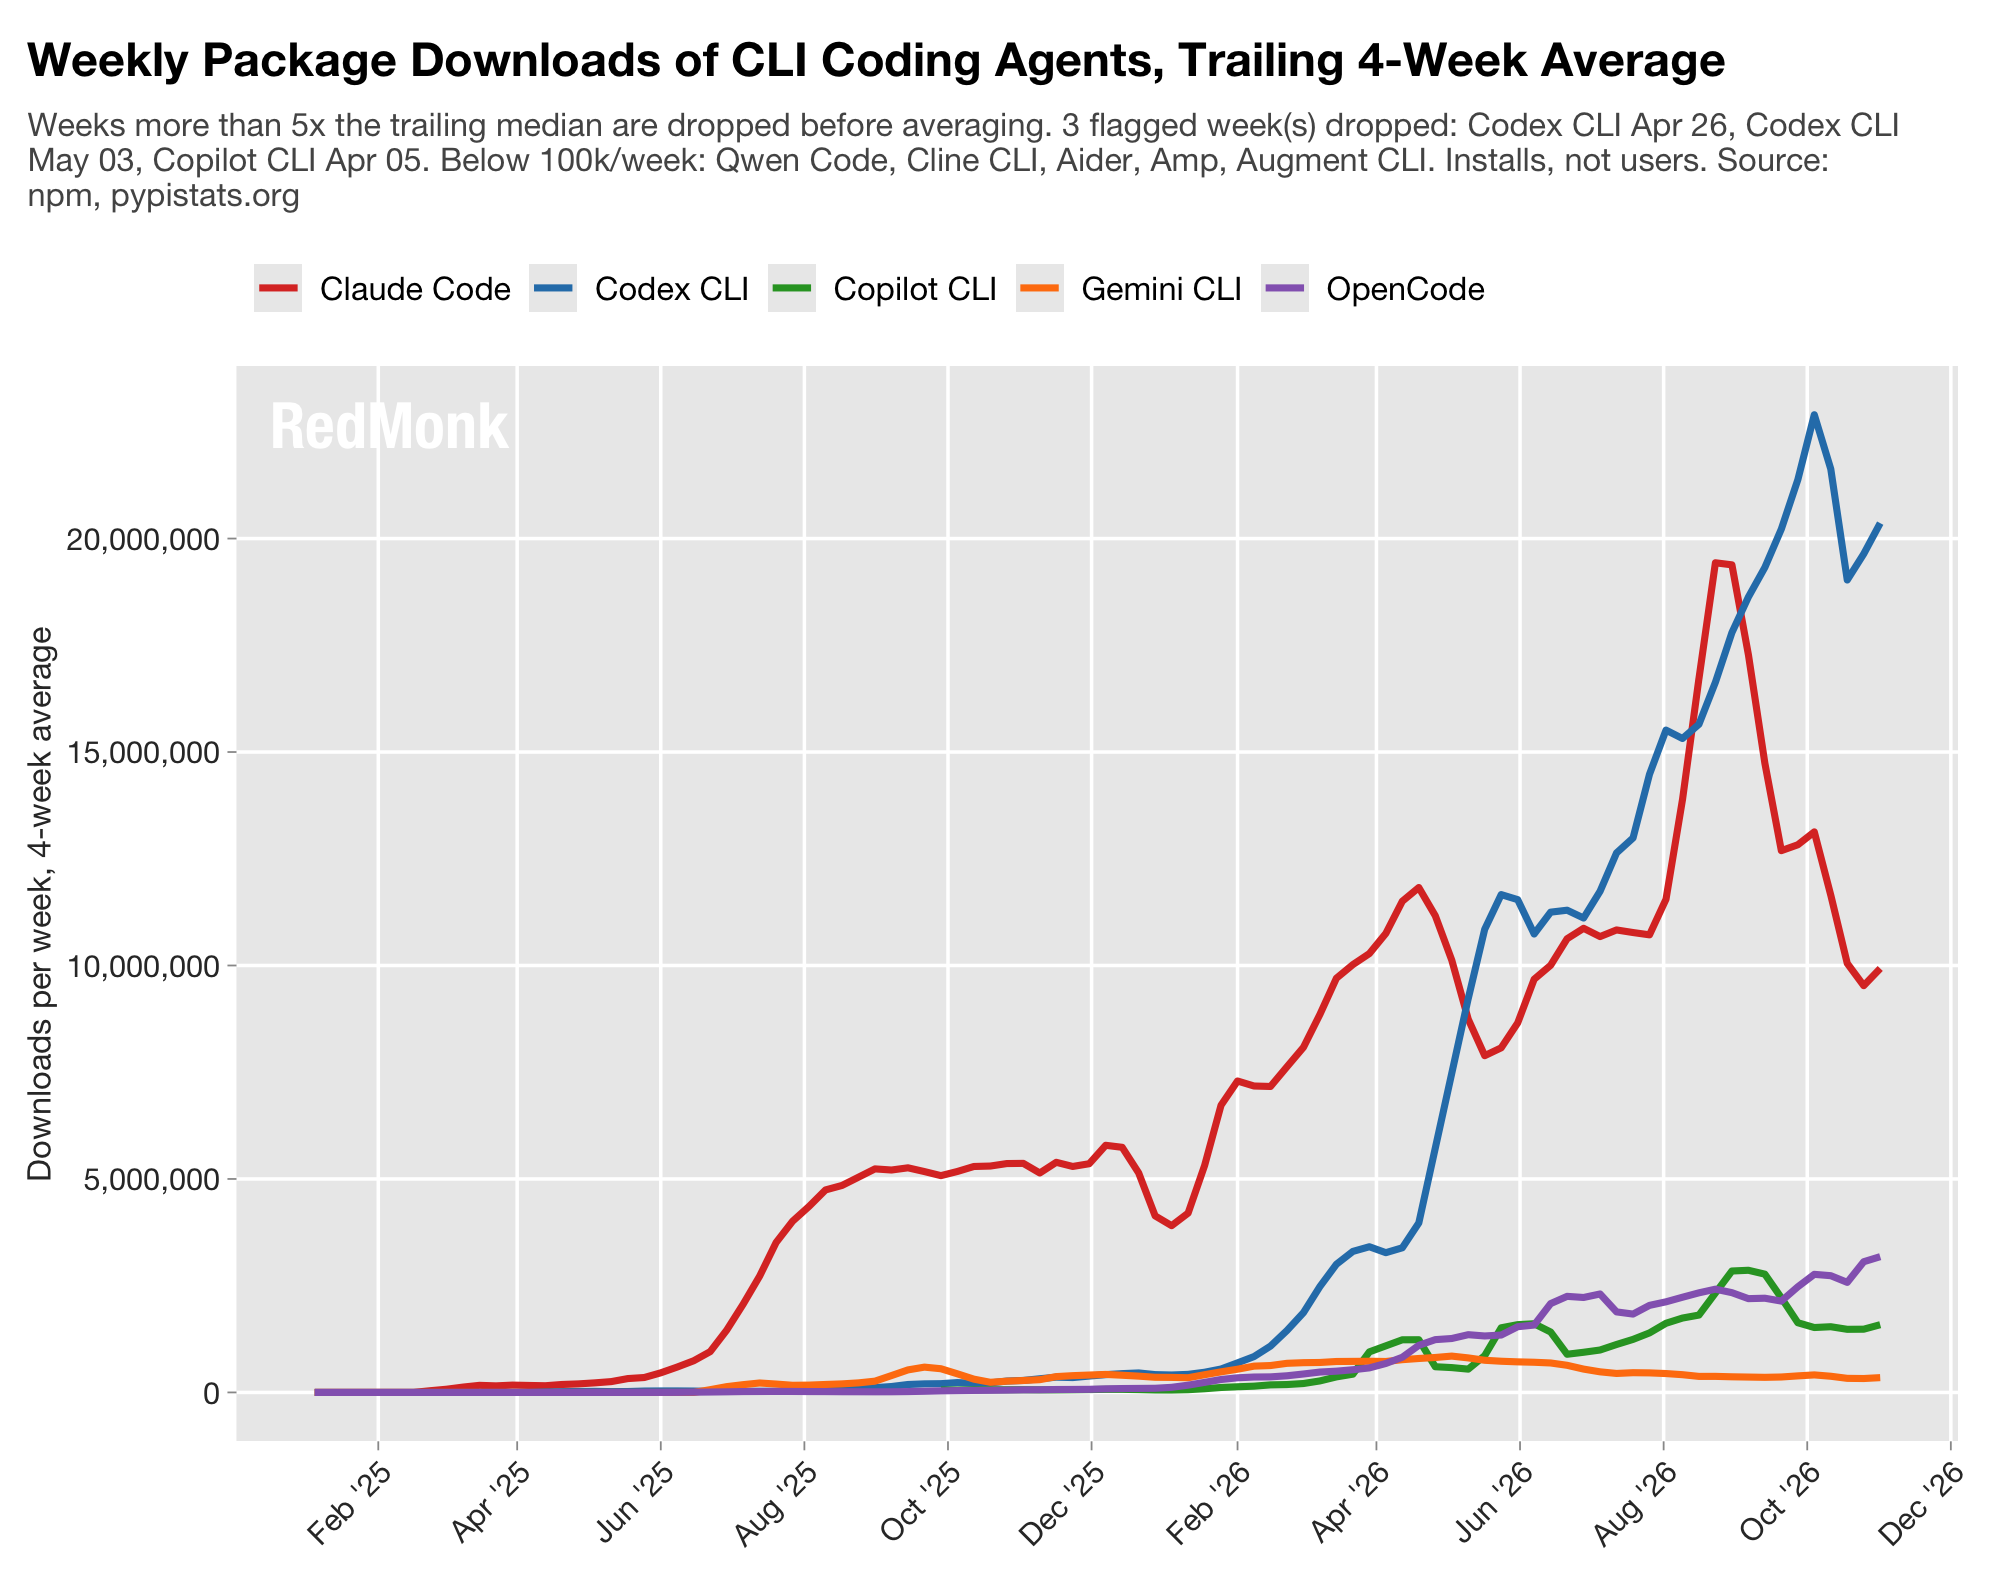
With that said, it’s no surprise to see Claude Code and Codex battling it out for the top spots. OpenCode’s steady rise is notable, as is Copilot’s. In the absence of the dominance of CC and Codex, their performance would stand out more. Gemini CLI, meanwhile, has been deprecated in favor of Antigravity which isn’t measurable here.
AI Contribution Attitudes
Beyond understanding how the agents are performing, it’s important to understand how attitudes towards agents are today and how they might evolve over time. My colleague has looked at this question previously, and this index is intended widen the scope of our analysis. To begin with, we searched CONTRIBUTING.md files for agent-related terminology.
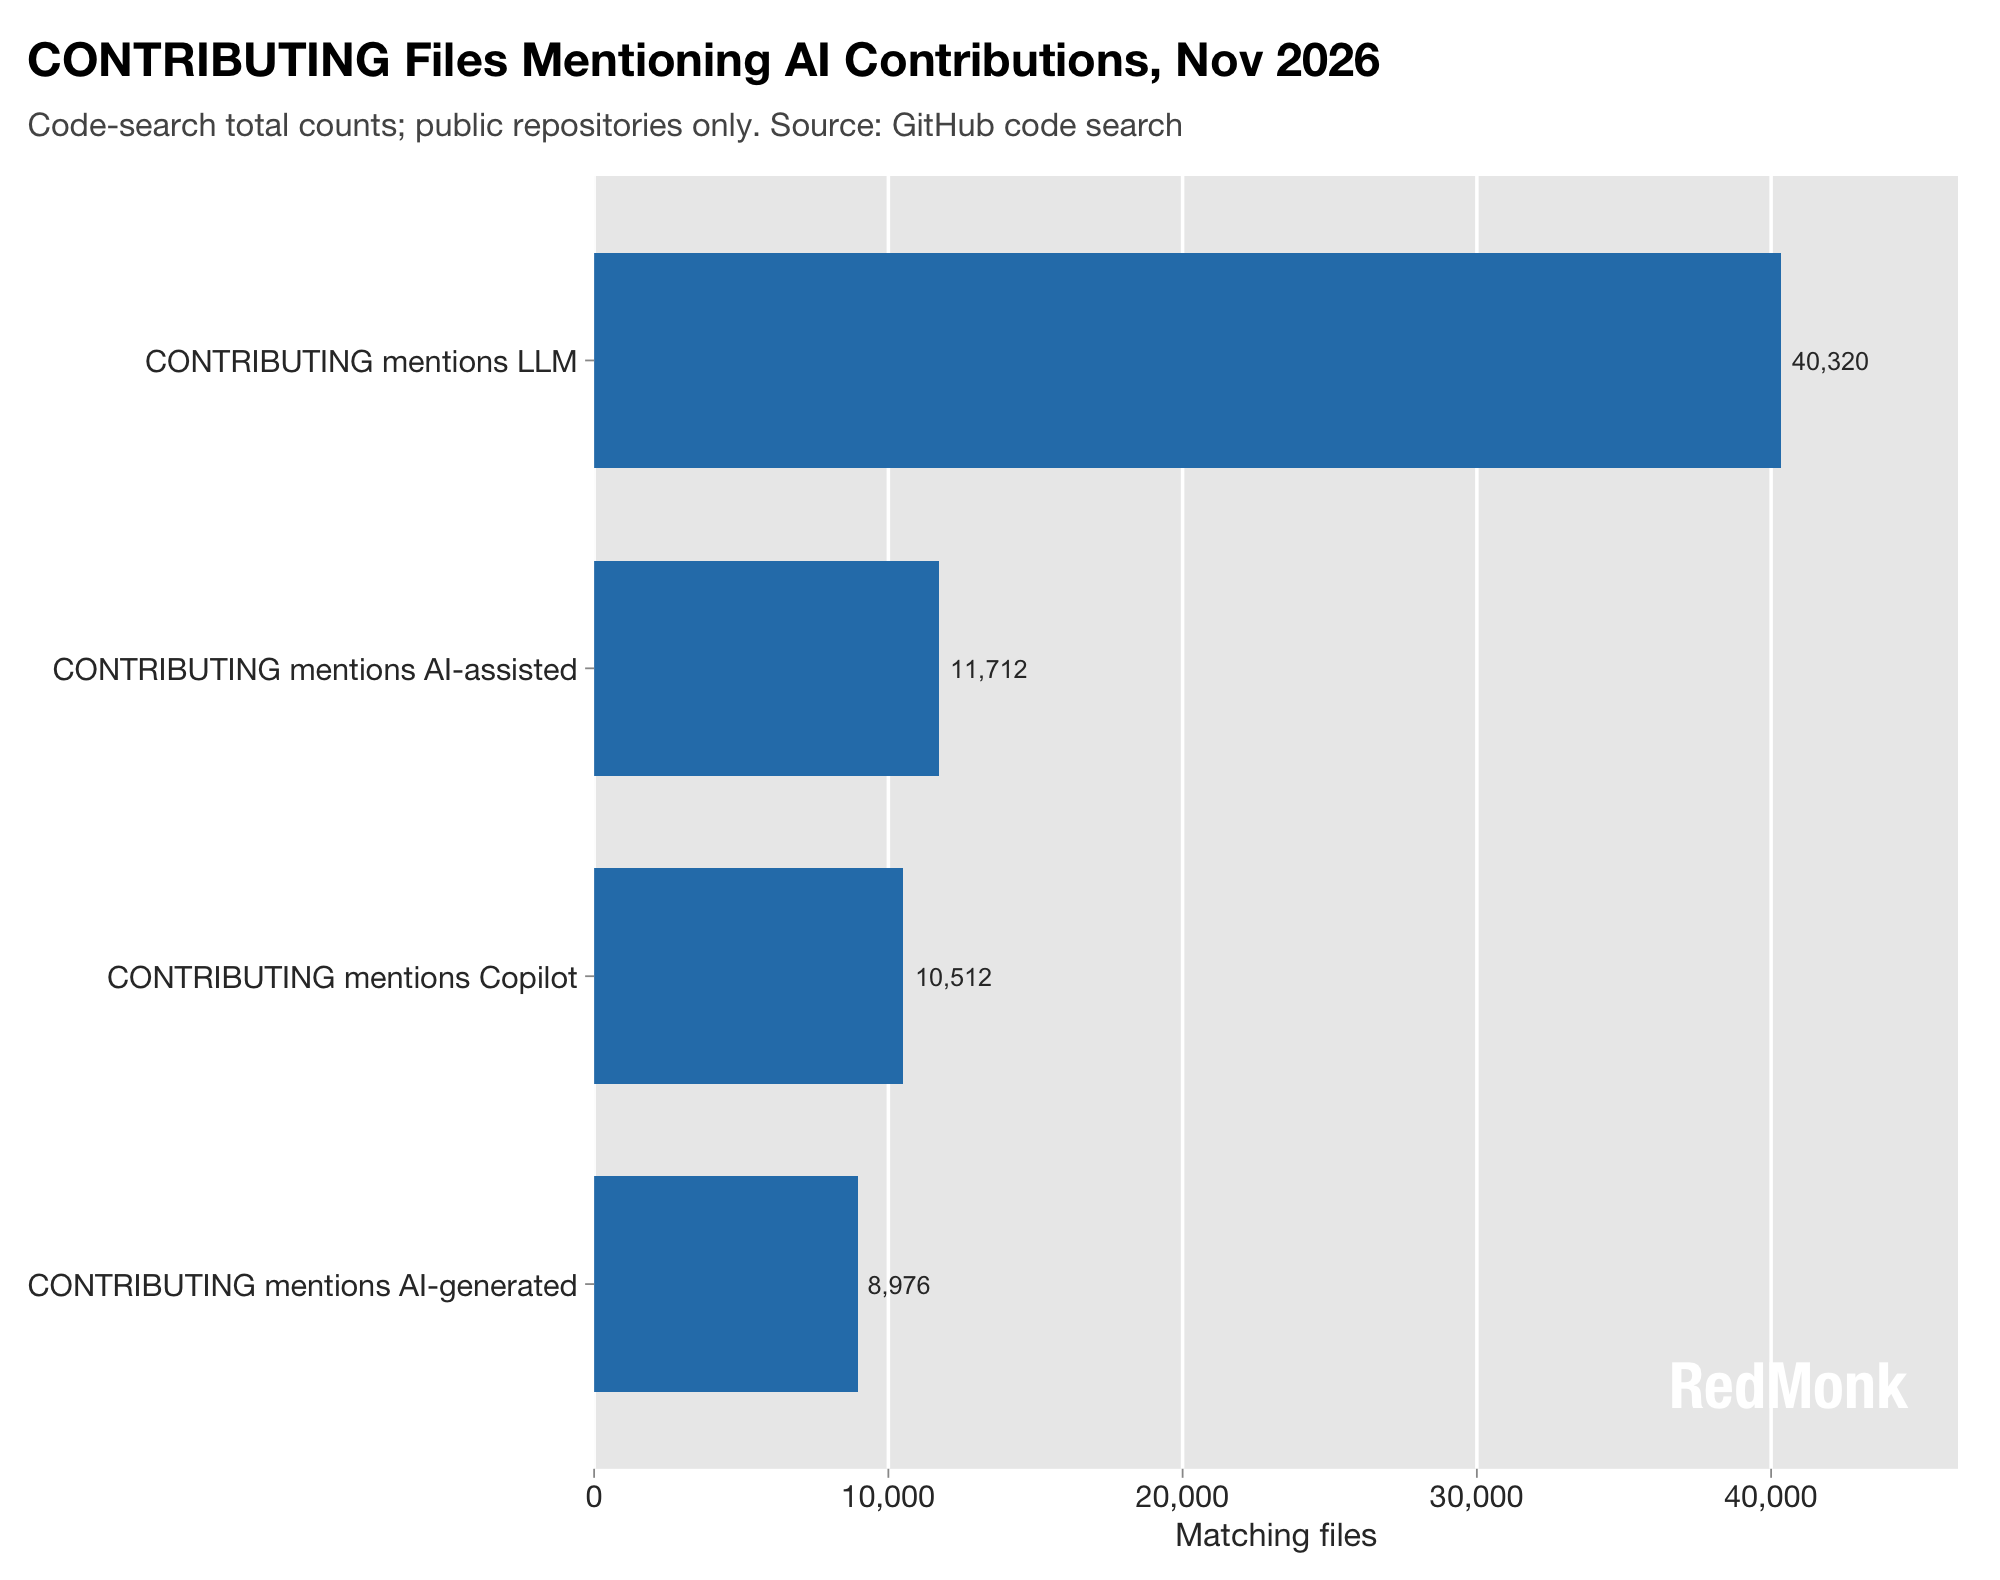
Unsurprisingly, generic LLMs are mentioned the most followed by more specific examples like AI-generated. The next level down, we look at three broad categories of agent-related policies: agent contributions allowed, restricted (in which some uses are allowed but some are not) and disallowed.
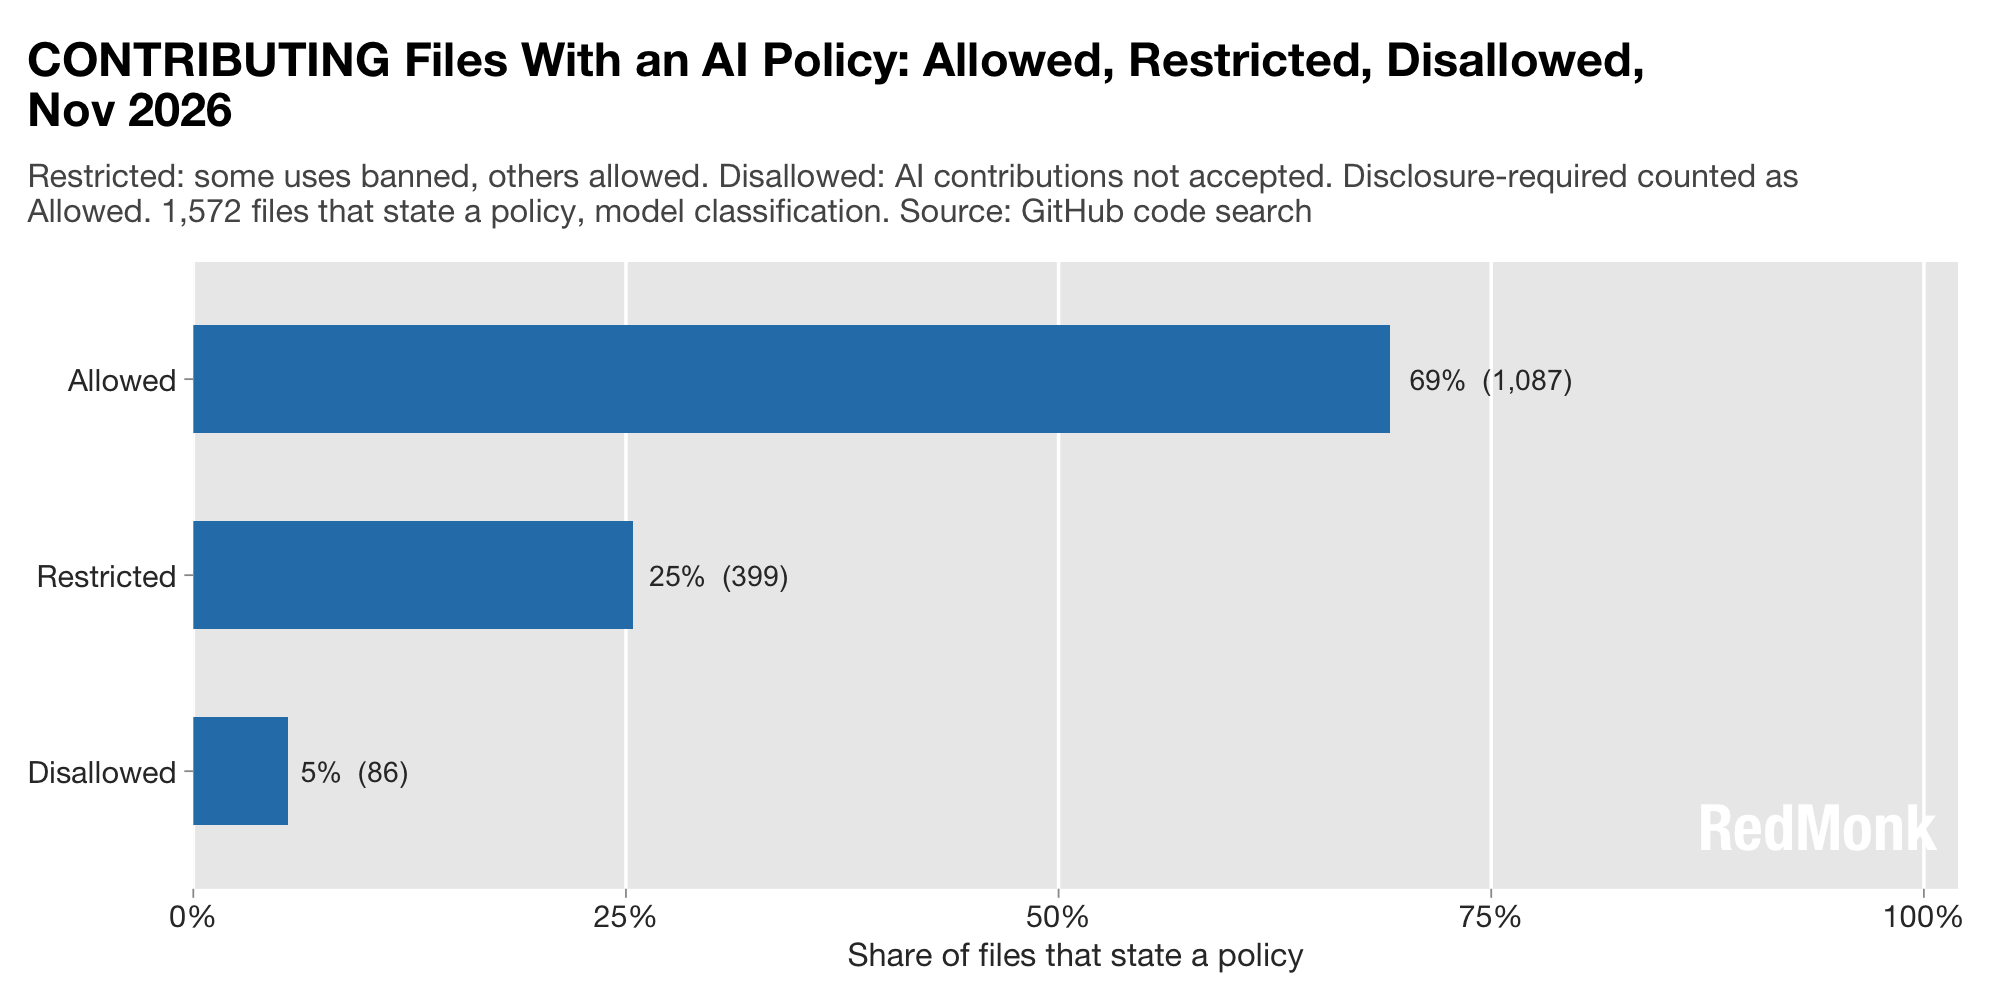
Of the 1500+ policy files that turned up in search, almost 70% of them allowed AI-contributions compared to 5% which expressly forbade it. That’s interesting, but doesn’t provide enough context. Teasing that apart in more detail, then, here is the breakdown of how specific AI-policies are selected – or not.
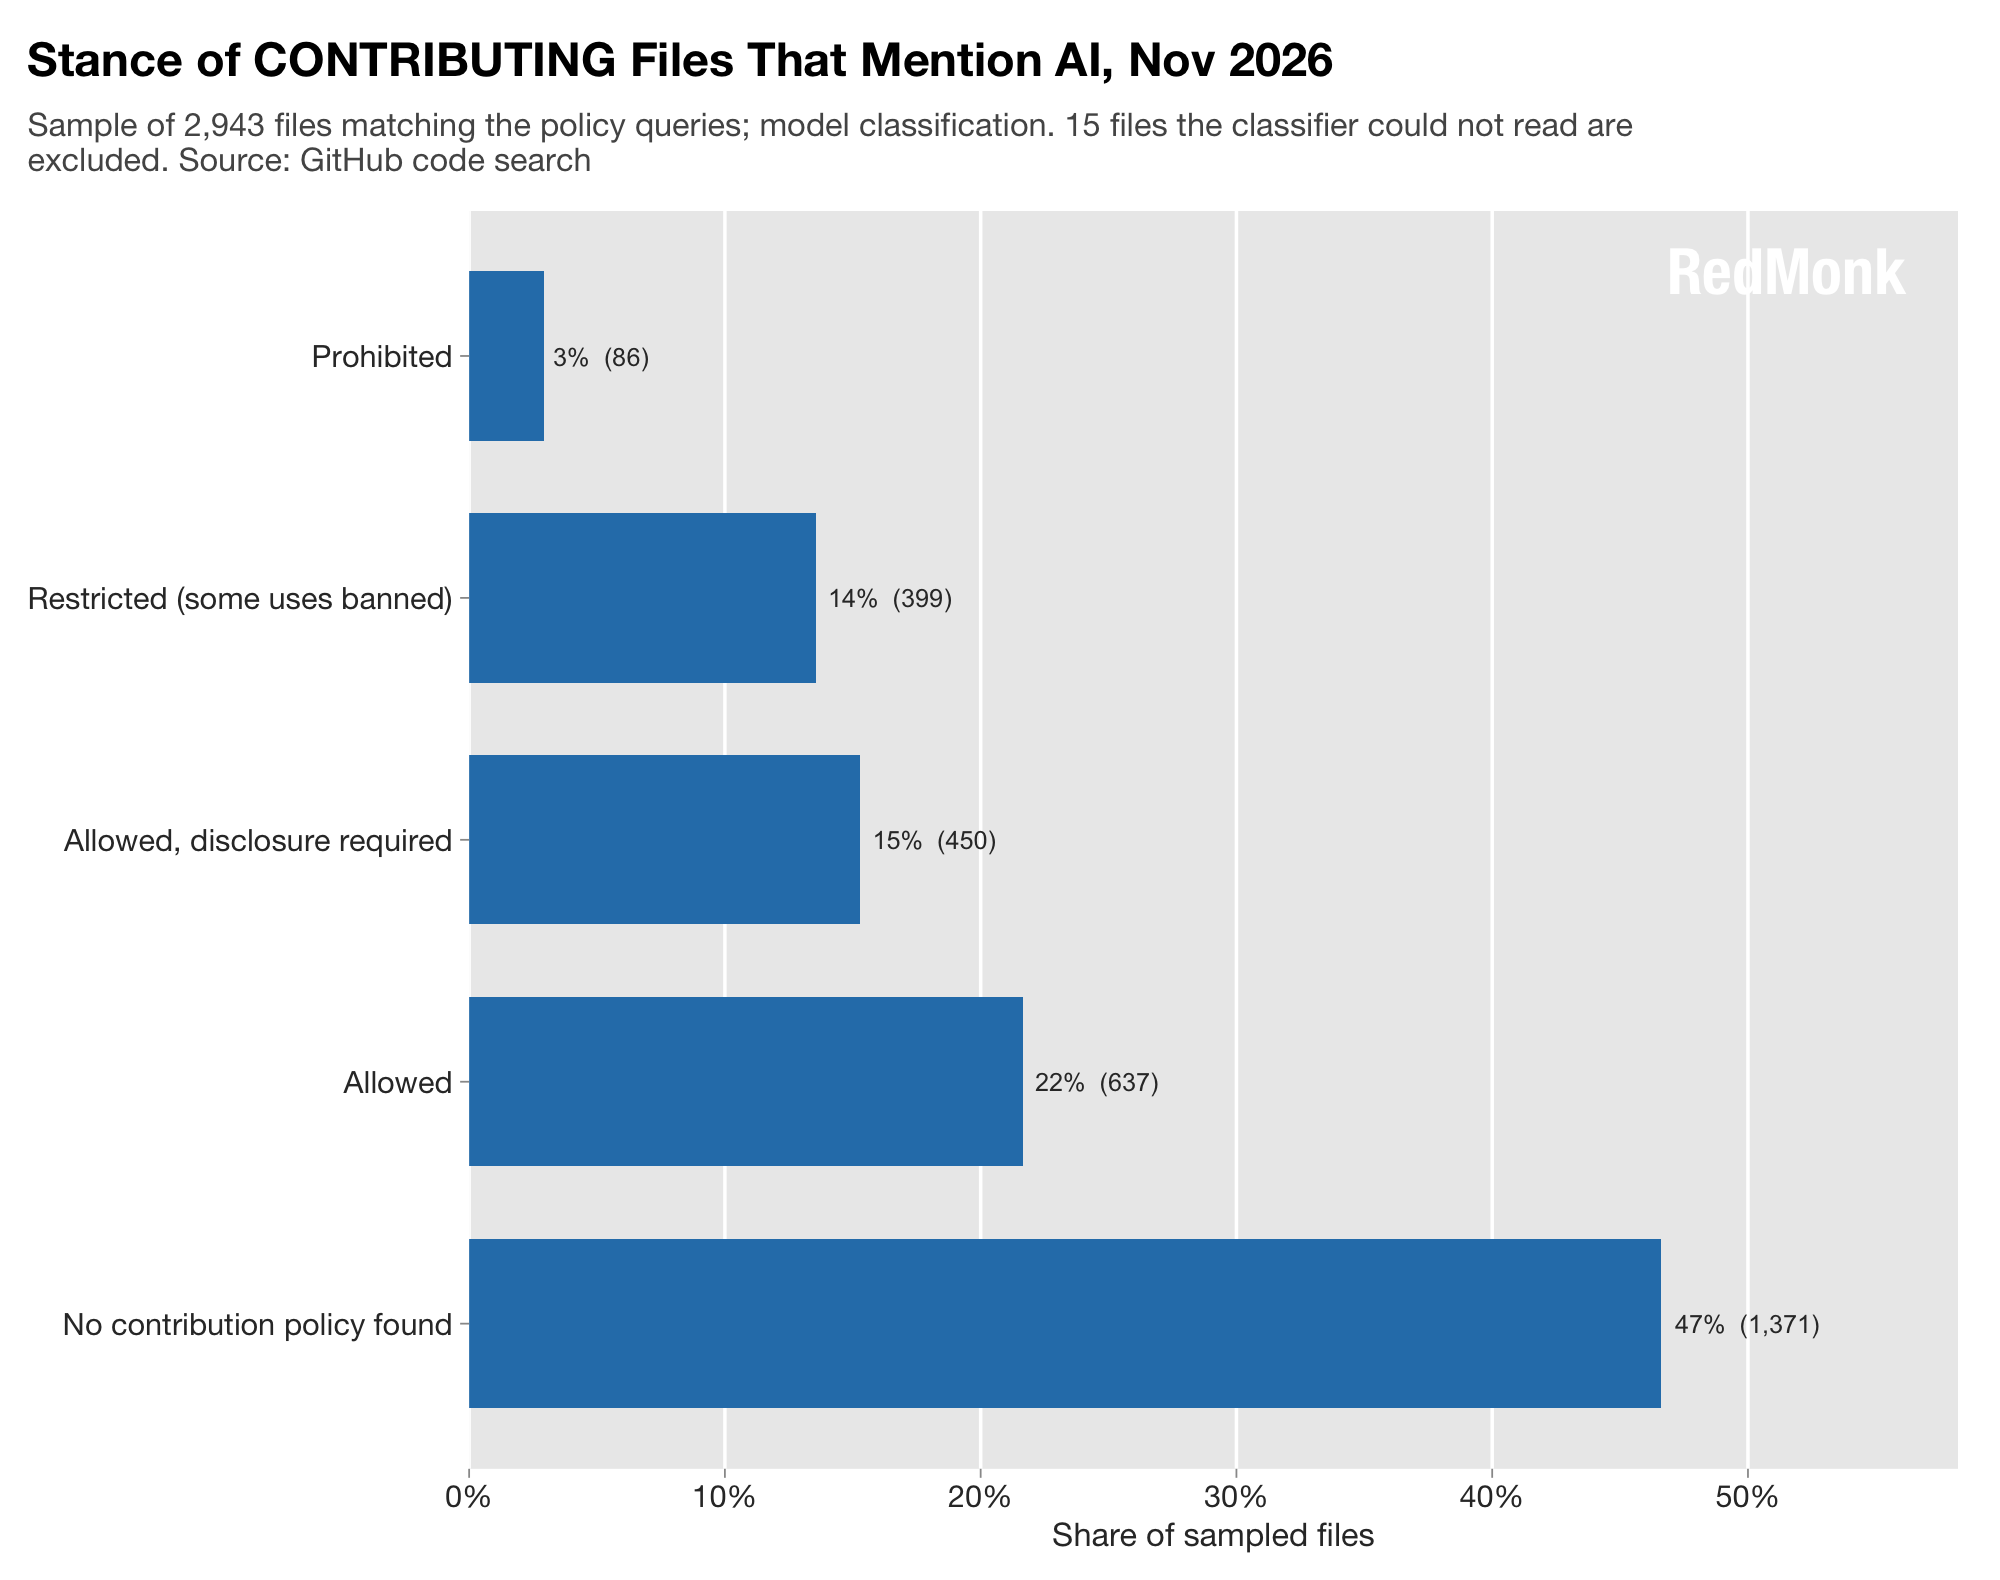
Just as the majority of projects on GitHub carry no active license, open source or otherwise, almost half of the surveyed projects likewise have no active AI contribution policy. Of those that do, the majority allow it, followed by allowing it but mandating disclosure, then some restrictions and finally prohibited all together. So of those projects that have a policy, it tends to favor AI rather than disfavor it.
Two important notes: first, when reading the charts, remember that the denominators differ, in that the second chart in this section is only files with policies, while the third is all sampled files that mention AI, whether they have a policy or not. Second, a caveat: these are model classifications and move several points between runs; treat the ordering as reliable and the exact percentages as approximate.
Agent Activity Per Forge
With the rather large caveat that due to API restrictions, the sample sizes on these forges are wildly different (hence the “indicative only”), the following are the share of active projects with any agent-generated merge requests and the share of merge requests that were created by agents.
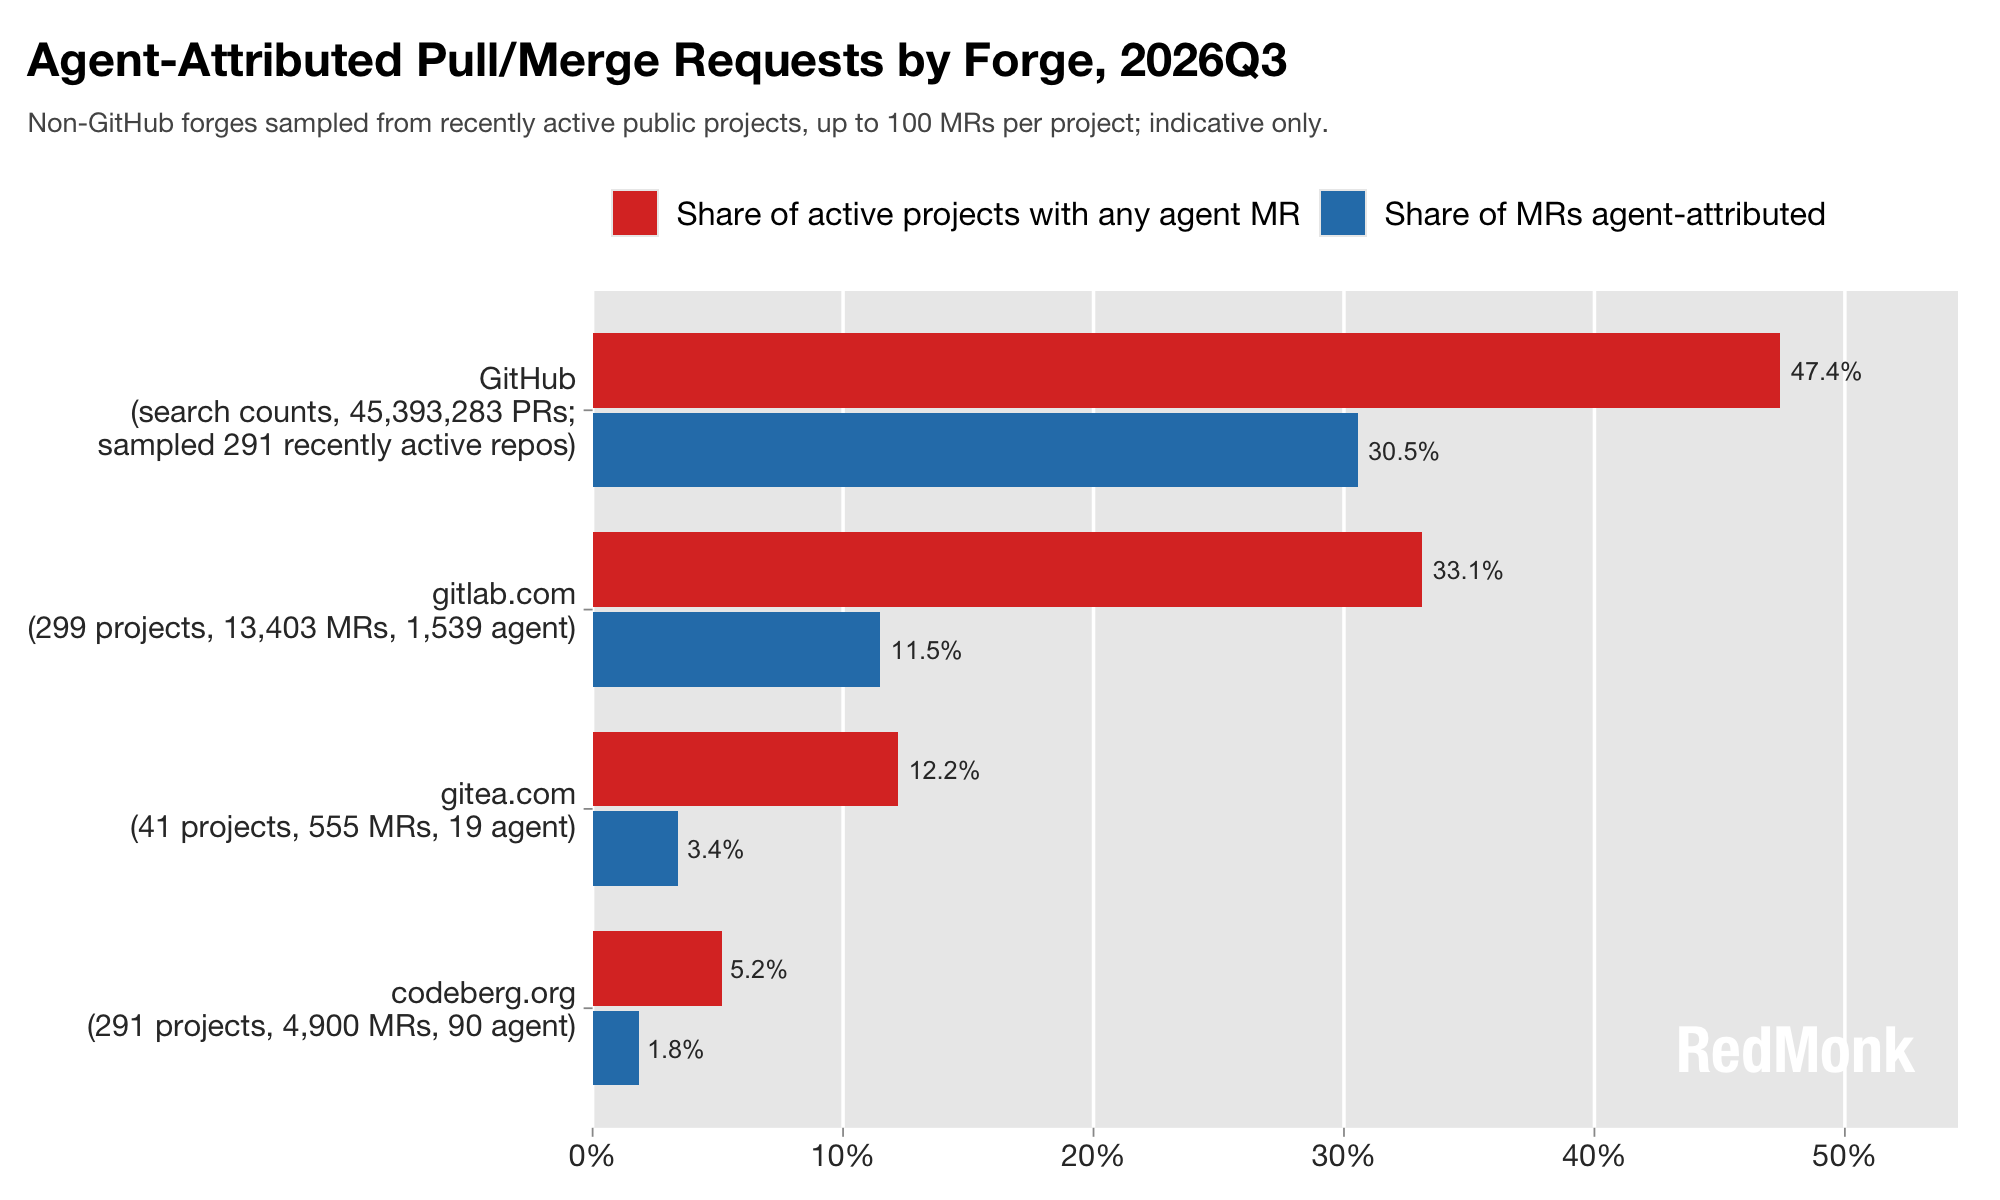
While we can’t read too much into this because of the aforementioned data sampling issues, it’s notable that GitHub has an observably higher percentage of agent activity. This may or may not be related to the company’s multi-year focus on AI beginning with Copilot.
Agentic Code Review
Code review across the industry is incredibly fragmented, with an enormously wide spectrum of approaches ranging from no human code reviews to continued, mandated human reviews of every line of code pushed to production. This data can’t tell us much about the role of humans in code review, but querying the “reviewed-by:” data on GitHub can give us an interesting look at what agents developers are using to review their code – whether that’s as a complement or replacement for a human. Here is the share of opened pull requests reviewed by AI reviewers.
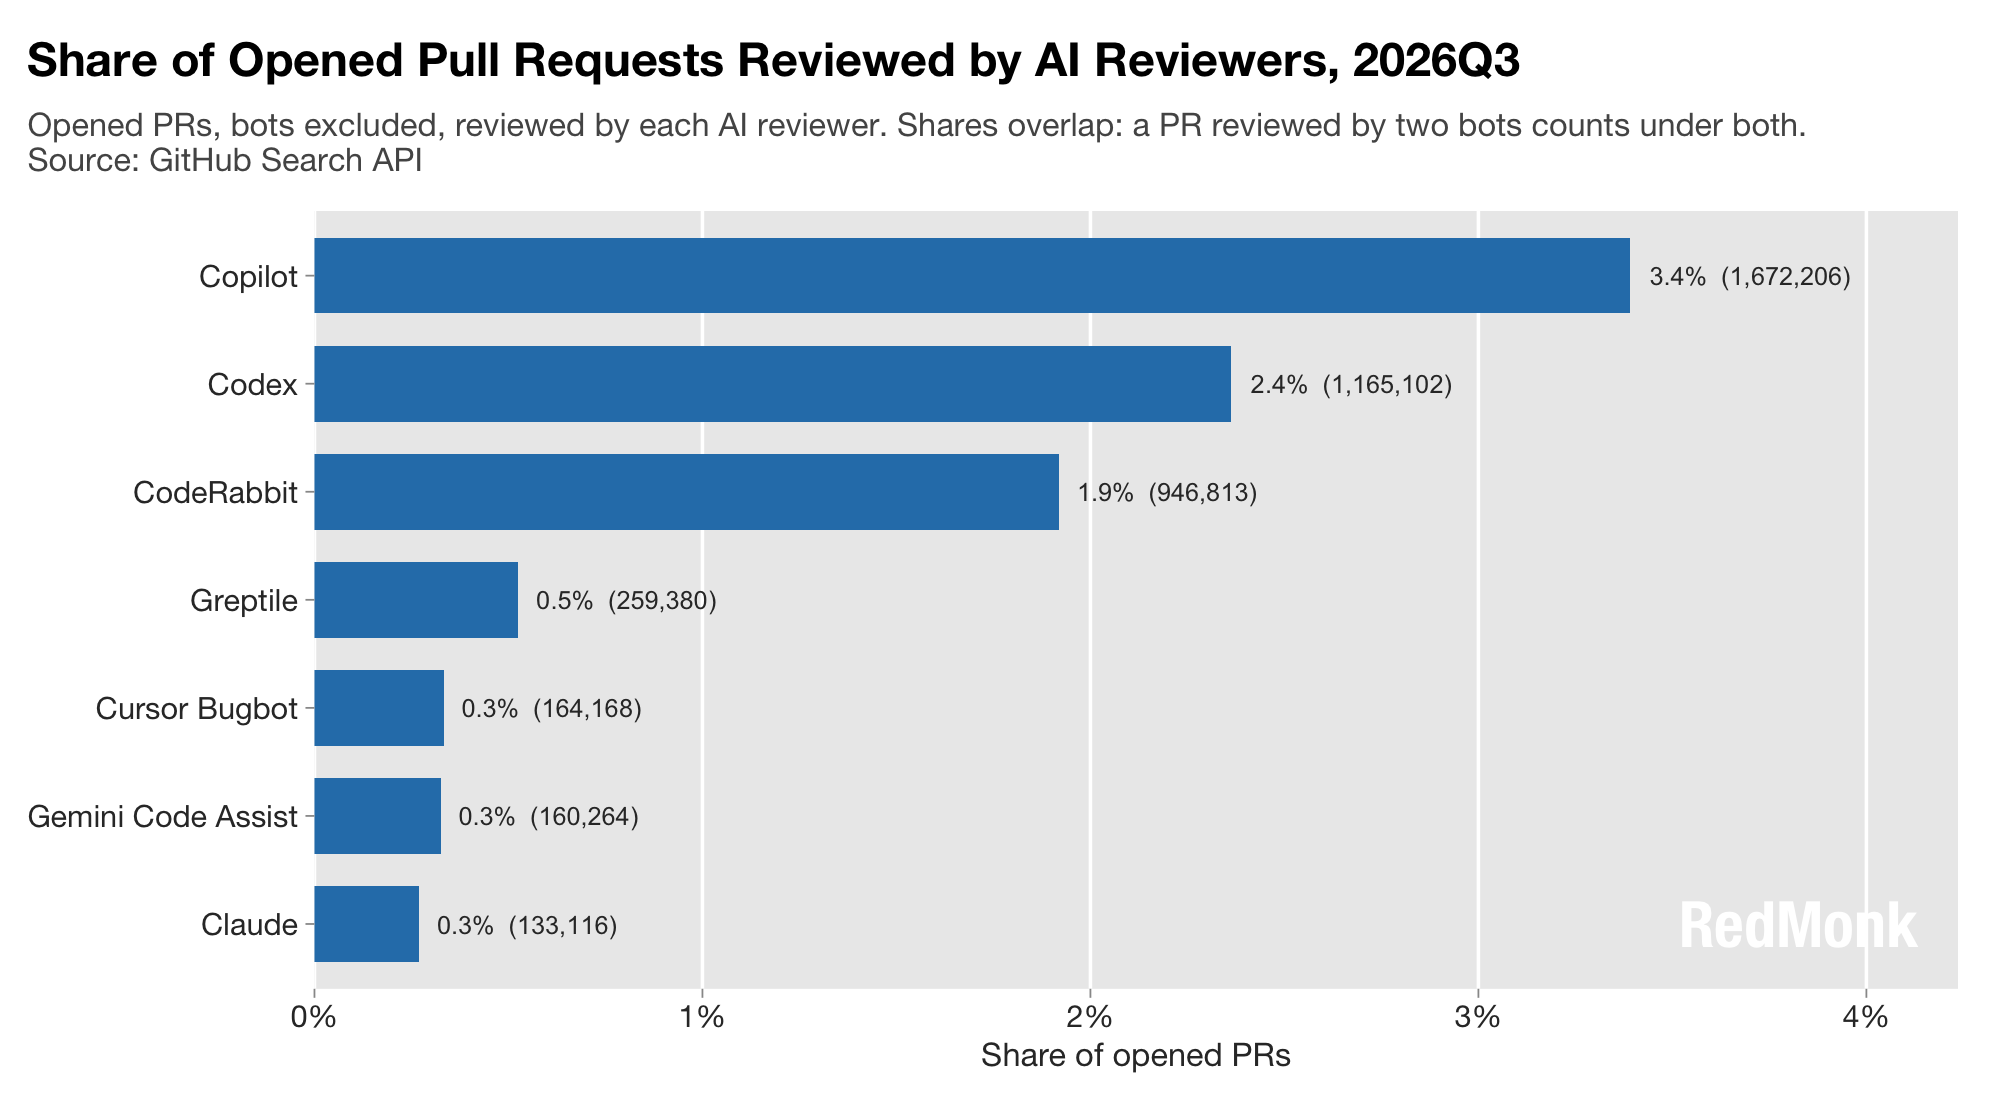
As might be expected, as the platform’s native review tool Copilot has the largest share of reviewed PRs on GitHub. CodeRabbit’s traction here likewise is worth noting. Speaking of CodeRabbit, they interestingly review more Rust and Go code than second place Codex does.
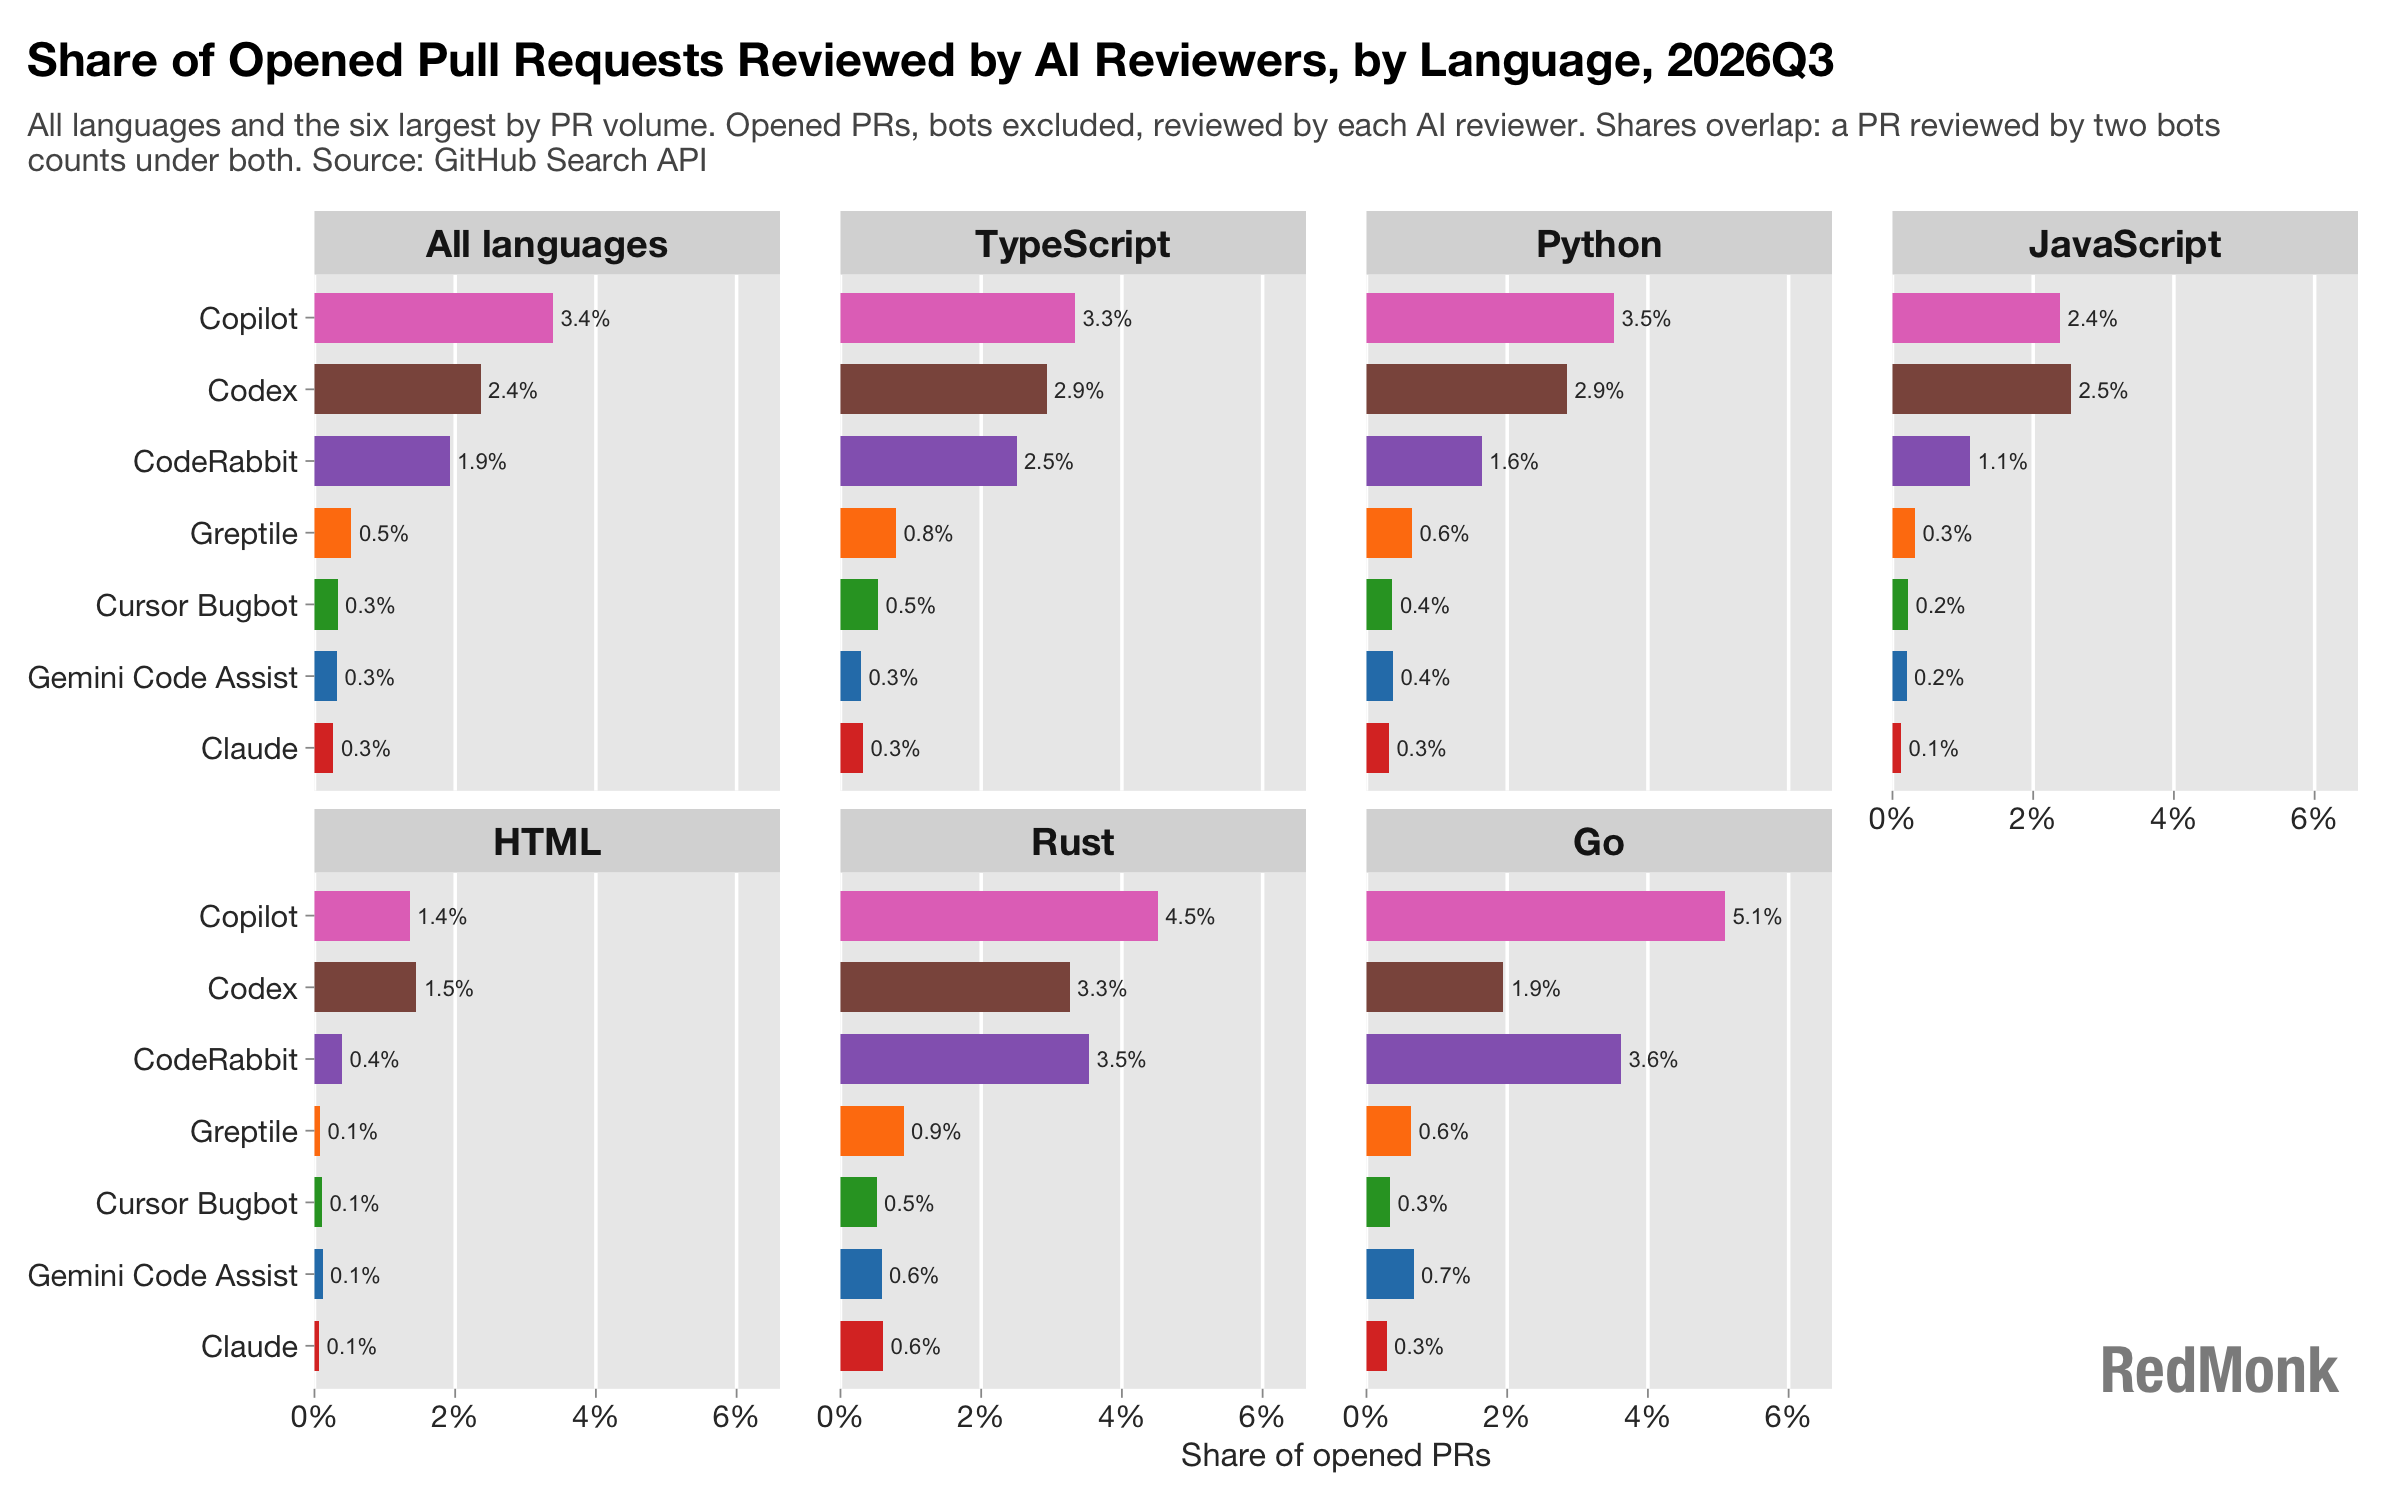
It’s likewise a mild surprise that Codex reviews slightly more JavaScript code than does Copilot. Copilot’s outperformance on Go, meanwhile, is curious.
The Net
Interesting as this exercise has been, the hope is that its real import – as with our language rankings – comes in repeating the analysis over time so we can look beyond a single snapshot in time and towards longer term trendlines in the industry.
This being a first effort, undoubtedly there will be improvements and necessary fixes and updates to the process, but for now expect quarterly updates to this index so that a better and more comprehensive picture of agent usage, behavior and traction emerges over time.
Disclosure: AWS (Kiro), CodeRabbit, GitHub (Copilot), GitLab, Google (Antigravity/Gemini/Jules) are RedMonk clients. Aider, Anthropic (Claude Code), Augment, Codeberg, Devin, Gitea, Greptile, OpenAI (Codex), OpenCode, Roo Code and SpaceX (Cursor) are not currently RedMonk clients.
