In December of last year, Drew Conway set out to quantitatively explore programming language popularity. Rather than choose between GitHub derived raw project volume numbers and the proxy of community discussion metrics extracted from Stack Overflow, he proposed to measure and compare them both.
The resulting analysis was fascinating, featuring both a high correlation and an obvious stratification of language popularity. Ten months later, we repeated this analysis to see what, if anything, had changed.
Working backwards from the original dataset, we recompiled the list using the GitHub website and the R script written by Conway. Here’s our updated data (note that higher rankings are better):
From there, we replicated the original scatterplot, as seen here.
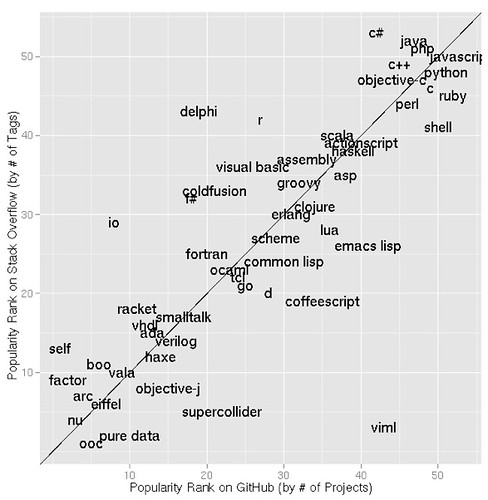
Like Conway, we found both a high correlation – it’s slightly higher this time around, actually, at .79 versus .78 – and easily detectable language tiers. The first point tells us that GitHub and Stack Overflow generally agree; although as the original post notes, it’s impossible to say whether language popularity is a product of community traction or the reverse. The second point is interesting and worth exploring further. According to our plot, we essentially have four tiers of languages, in terms of popularity.
Tier 1
C, C++, C#, Java, JavaScript, Objective-C, Perl, PHP, Python, Ruby, Shell scripts
Tier 2
ActionScript, ASP, Assembly, Clojure, Coffee Script, Cold Fusion, Common Lisp, Delphi, D, Emacs Lisp, Erlang, F#, FORTRAN, Go, Groovy, Haskell, Lua, OCaml, R, Scala, Scheme, Tcl, Visual Basic
Tier 3
Ada, HaXe, Io, Racket, Smalltalk, Verilog, Vhdl
Tier 4
Arc, Boo, Eiffel, Factor, Nu, Objective-J, Ooc, Pure Data,Self, Supercollider, Vala
Before we get into what the above means, a few caveats. First, this is understood to be an incomplete list of programming languages: the omission of COBOL, still very much in use, should make that obvious. Second, this is a measure of two specific communities, and therefore reflective of the respective biases in terms of usage of same. This kind of analysis is observational in nature, and therefore cannot be considered representative of the market as a whole. And last, a quick logistical note: we dropped two languages from the original list – sclang and duby – because they had dropped off GitHub’s project list.
With that out of the way, our results – like Conway’s before – pass my basic sniff test. There are a few mild surprises – Erlang and D are a bit lower than I expected, Go slightly higher – but there are no glaring errors to my eye. If this is the reliably the case, we will have gained an important tool in the triage that inevitably results from runtime fragmentation coverage.
Besides repeating last December’s analysis, we were also able to compare our findings with the raw numbers from the previous study to look for trends. The changes in GitHub rankings were generally minor, particularly amongst the top 10. There were some interesting tidbits in the growth rates of Stack Overflow tags, however. The highest growth – our apologies to Bryan Cantrill – came from CoffeeScript, which has seen 1527% growth in related tags since December. This is misleading, however, as CoffeeScript’s actual growth was 336 tags over that span. Filtering for languages with a minimum of 5,000 tags, then, here is what’s left.
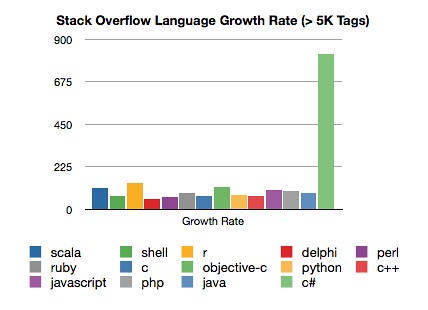
The filtered listed is essentially our Tier 1 languages plus Delphi, R and Scala. If we exclude C#’s remarkable performance, the average growth for this list is 87%. Healthy, relatively undifferentiated numbers for each, with R leading the non-C# pack at 136%. None can touch the growth of C# on Stack Overflow, however. With 823% growth since December, Stack Overflow has added more C# tags than there are in total for Java, JavaScript or PHP. This type of growth is worth exploring, and likely of interest to vendors like Microsoft or Xamarin.
The Takeaways
- As an industry, we have the first tier languages mostly correct. While arguments can be constructed that Clojure, R, Scala et al may be considered first tier languages in certain contexts, the numbers don’t quite justify this within the studied communities. Further, the metrics strongly indicate that legacy compiled languages are not being replaced by interpreted alternatives, but rather are coexisting with them.
- The strong correlation between GitHub and Stack Overflow indicates that using community behaviors as a proxy for actual language traction is a viable approach. This validates the idea that we can infer developer behaviors by tracking associated community trends; this is, in part, the central assumption RedMonk Analytics is built upon.
- Quantitative analysis of programming language usage – and importantly, trending – will become an increasingly useful tool over time to both buy and sell side technologists, albeit for differing reasons.
- There is something unique happening within the Stack Overflow community with respect to C#; the cause of the surge in related commentary there is worth exploration.
- The presence of Objective-C in the Tier 1 grouping – and potentially the continued growth of C# and Java – hints at the importance of mobile development in runtime and tool selection.
What do you see in the above?
Credit: All credit for the idea behind this analysis belongs to Drew Conway; we’re merely replicating the study he originally conducted. All data used, meanwhile, is courtesy GitHub and Stack Overflow.
Disclosure: GitHub and Microsoft are RedMonk clients, while StackOverflow and Xamarin are not.
