This iteration of the RedMonk Programming Language Rankings is brought to you by Microsoft. Developers build the future. Microsoft supports you in any language and Java is no exception; we love it. We offer the best Java dev tools, infrastructure, and modern framework support. Modernize your Java development with Microsoft.
As part of RedMonk’s analysis about language rankings, here’s a visualization that tracks the movement of the top 20 languages over the history of the rankings.
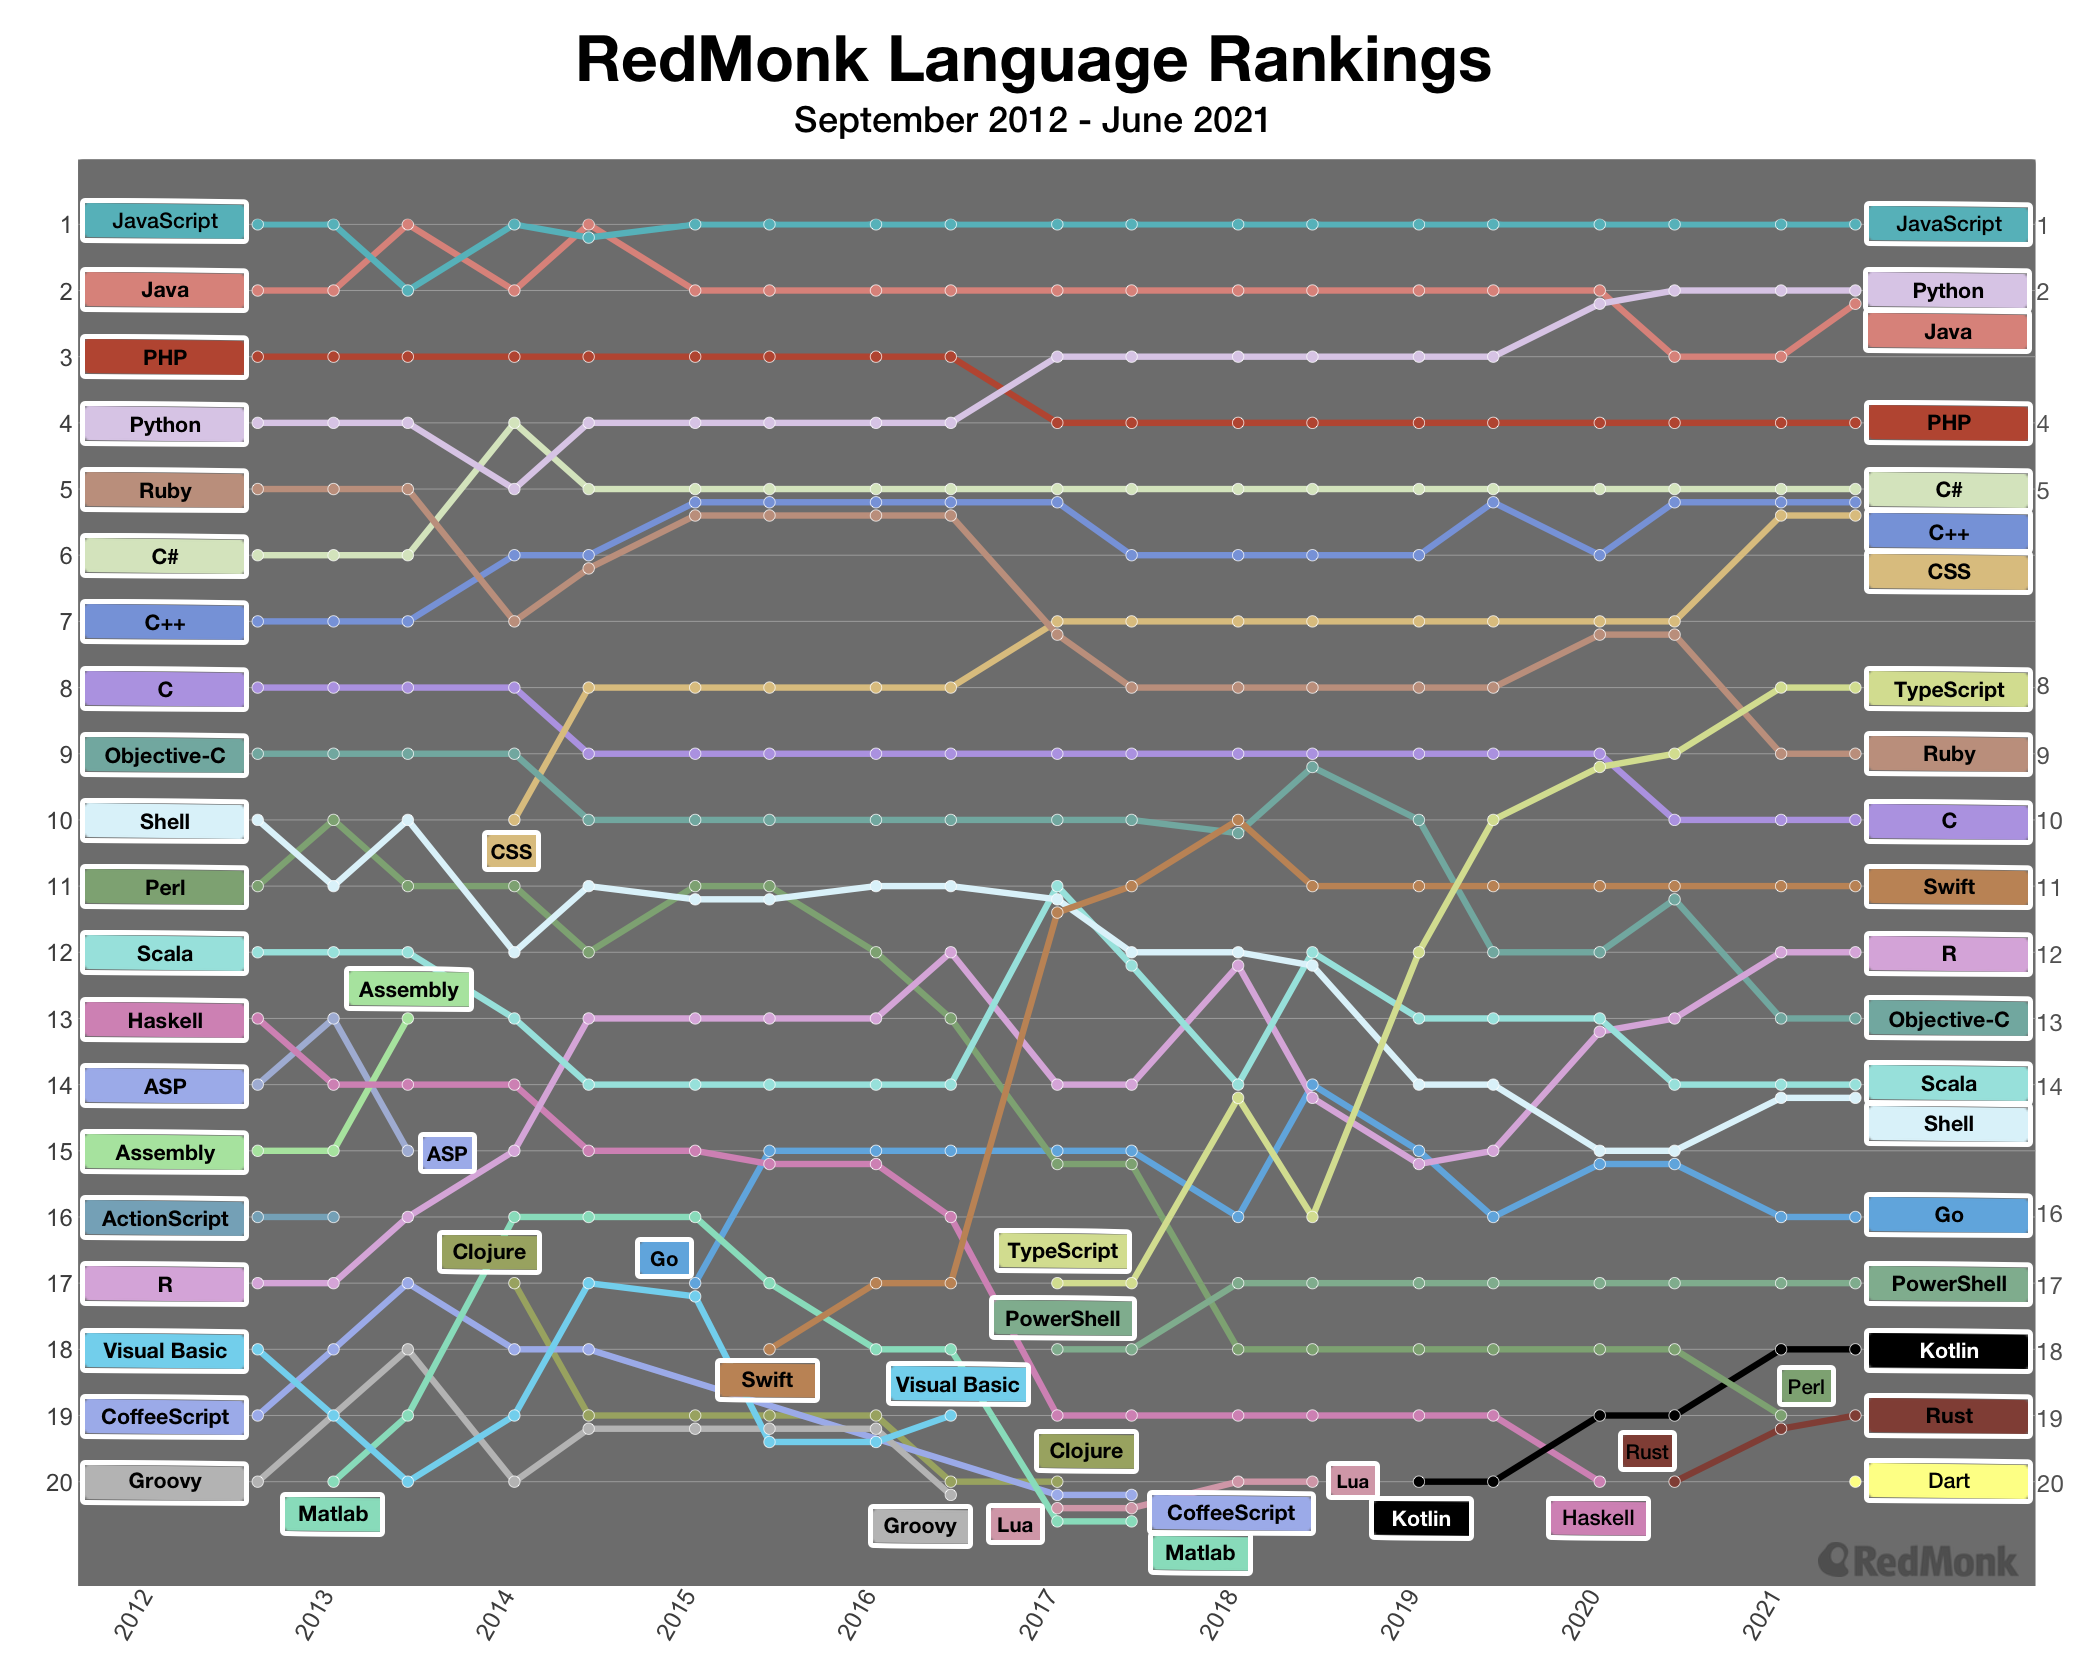
More commentary about notable movement among languages can be found in the primary analysis.
Interpreting the Chart
You can track a specific language’s ranking over time by following the horizontal progression of the language’s rank over time. You can review the Top 20 languages of any given iteration by running through the respective data points vertically from top to bottom.
Any time points are clustered, that means there was a tie and multiple languages share the rank.
If a language was previously on the chart but is no longer visible, it means the language is no longer in the RedMonk Top 20. (While they are no longer included in this specific visualization, rest assured they are still active and vibrant communities.)
Languages that break into the RedMonk Top 20 are seen as new entrants to the chart. (Just like the languages that drop off the top 20, these didn’t ascend from nowhere. They were previously rising in the ranks before becoming top 20 languages.)
Common Questions About the Rankings
Why do you create these rankings?: These rankings attempt to correlate trends between language usage and discussion around a language. We don’t proclaim our rankings to be precise, statistically-valid measurements of popularity; instead we see them as an attempt to aggregate trends across two major developer communities.
How do you create these rankings?: Please see the full analysis for a complete description of the process, but at a high level we measure traction as seen via GitHub pull requests and Stack Overflow discussion.
Why GitHub and Stack Overflow? That’s going to over-represent/under-represent certain communities.: Agreed, these measures are imperfect. More specifically:
- We don’t claim these rankings are representative of broader use (i.e. we do not claim that language usage as seen on public GitHub repos is equivalent to total language usage)
- Communities often connect in forums outside Stack Overflow. Unfortunately, we cannot run a separate query process for a hundred different languages across a variety of forums that range in openness of data availability.
We use GitHub and Stack Overflow first because of their size and second because of their public exposure of the data. We encourage interested parties to perform their own analyses using other sources.
Don’t incumbent languages have an inherent advantage here? Indeed they do, as the metrics from GitHub and Stack Overflow are accretive. While rates of growth will be fastest for new projects with a smaller base, from a cumulative perspective new language entrants are behind from the day they are released. Displacing the most popular languages is a significant and uphill battle.
Has your process been consistent over time? We’ve tried our best to keep things as consistent as possible, but we had to adapt to changes in data availability from GitHub in January 2014 and again in January 2017. You’ll notice there is higher than typical change in those periods; the linked posts above may be helpful for those trying to sort out change due to process and change due to adoption trends.
CSS is not a language. This is inevitably raised every iteration of this analysis. There is probably someone who wants to debate this with you in the comments below or on Twitter / Reddit / Hacker News. While we mostly stay out of the debate on this particular topic these days, we welcome this grand tradition.
Classement des langages de programmation : Java crée l'équilibre - Bayl - Bayl says:
August 9, 2021 at 6:34 am
[…] Comparaison des classements d’une année sur l’autre, que RedMonk publie au premier et au troisième trimestre de chaque année, la course en tête-à-tête peut être observée de 2012 à 2021 : […]
Рейтинг языков программирования: Java создает баланс - Kuster.ru - Kuster says:
August 9, 2021 at 6:36 am
[…] Годовое сравнен&…, который RedMonk публикует в первом и третьем квартале каждого года, личную гонку можно будет наблюдать с 2012 по 2021 год: […]
Programming language ranking: Java creates the balance [ August, 2021 ] says:
August 9, 2021 at 6:38 am
[…] Year-on-year comparison of the rankings, which RedMonk publishes in the first and third quarter of each year, the head-to-head race can be observed from 2012 to 2021: […]
Kotlin, TypeScript, Rust, and Other Programming Languages on the Rise says:
August 16, 2021 at 6:15 am
[…] and which to potentially abandon in favor of something else. Fortunately, analyst firm RedMonk has spent years ranking programming languages. Here’s their latest […]
15 Top-Paying Programming Languages Aren't the Ones You Think says:
August 18, 2021 at 6:10 am
[…] a similar story with languages such as Perl that have dropped substantially over the past decade in usage and popularity, but nonetheless constitute a significant portion of many companies’ legacy code; although few […]
Stack Overflow 2021年 Q3 季度编程语言 – TopItInfo资讯 says:
August 23, 2021 at 7:03 pm
[…] RedMonk Top 20 Languages Over Time: June 2021 […]
Strengthening Cardano’s Infrastructure With Rust | AdaPulse says:
September 23, 2021 at 7:41 am
[…] associated networking protocol. However, Haskell developers are relatively few in number, and the language’s popularity is on the decline. This unfortunate reality is the source of production bottlenecks and integration issues throughout […]
Python Takes First Place in TIOBE Programming Languages Ranking - itsfoss.net says:
October 11, 2021 at 10:56 pm
[…] the RedMonk rating , based on the popularity assessment on GitHub and the activity of discussions on Stack […]
Orakle says:
February 23, 2022 at 11:53 pm
What’s not said is that Python is mostly used for “prototyping” teeny apps for the simple reason that it’s easier to do so. Python’s also seen as a shining beacon on the ML front simply because there aren’t better alternatives. Well, there are like say Julia or Swift but they don’t have the community size that Python does. Java and JavaScript despite a few drawbacks are the ones that continue to fuel “enterprise” application development. And this will continue because their heritage is The C Programming Language.
Programming language ranking: Java creates the balance | Marijuanapy The World News says:
March 28, 2022 at 9:44 pm
[…] Year-on-year comparison of the rankings, which RedMonk publishes in the first and third quarter of each year, the head-to-head race can be observed from 2012 to 2021: […]