Common (mis?)conception states that development practices, standards, and cultures vary broadly depending on the size of an open-source community. In general, we expect that many solo projects may lack the same level of QA and rigor as those with multiple developers due to constraints on time, varying experience levels, etc., and they may not even be intended for consumption by others. As communities grow slightly larger, projects that successfully recruited multiple contributors would likely tend to be higher-quality, on average, than those that failed to do so. In the largest open-source projects with tens or hundreds of contributors, we generally expect a fairly high level of quality, attention to detail, documentation, and so on.
Here, I’m going to dig into data from Ohloh, which tracks a vast set of open-source software projects, to investigate some of the effects related to community size. I’ll look at a number of potentially connected variables centered around development activity, licensing choices, and hosting providers (GitHub, etc.).
As always, the caveats:
- This is only useful for active projects with active communities, because it contains only projects with commits during a 1-year period and members of the community must opt in to subscribe the project to Ohloh. This equates to 50,000+ projects, so it’s still a good-sized set.
- It is subject to any imperfections in Ohloh’s measurements, which is particularly relevant for license detection where it simply looks for strings in source files. It will miss any indirect references to licenses by name or URL. It also seems to miss some more obvious ones, which will set a lower bound on license discovery (but it should be independent of community size).
- In most cases, I’m ignoring the largest ~100 projects on Ohloh, which have ~150 or more committers per year, so these conclusions may not be generalizable to them. These tend to include well-known names like GNOME, Chrome, KDE, the Linux kernel, Mozilla, etc. There simply aren’t enough samples of things at similar size to aggregate data for general, non-project-specific conclusions.
To make these posts more easily readable, I’m going to try something new. All the methodology is now in the figure captions, so skip captions if you just want to read the what and ignore the how.
The size distribution of open-source communities
Before looking at the impact of size, I first wanted to gain an understanding of how big free/open-source software (FOSS) communities were, and how many project communities there were at each size. Plotting the community size against the number of FOSS projects at each size produced the plot shown below:

Global features
What I find interesting about the shape of the above graph is two things: the helpfully linear behavior on this type of plot, and the gap between monthly and annual contributors. When this type of plot appears linear, it indicates behavior supporting a set of statistical distributions including the power law (the famous 80-20 principle stating that 80% of the effect comes from 20% of the causes). In the below section on specific effects, I’ll show some numbers indicating the kind of behavior we see as a result of this.
One interesting question I wanted to answer here was the relationship between monthly committers and “expected” monthly committers based on the year-long figures — we can get this by dividing annual committers by 12. However, appearances can be deceiving. This graph actually can’t tell us anything about that because there’s zero connection between projects with 80 annual contributors and 80 monthly contributors. Instead, what we can do to get at this information is directly correlate monthly and annual contributors at the level of individual projects, which I’ll show later.
What can that gap tell us, then? As it turns out, it’s not equally sized throughout. There’s a very real and linear increase in that difference as community size increases from 1 to 35 committers (it’s too noisy above that), with the logarithmic difference increasing from 0.57 to 1.29 (each unit of 1.0 indicates a 10x increase). The higher slope for the monthly committers indicates a set of values with a tighter overall distribution that are (unsurprisingly) biased away from high numbers of committers, which are much more easily attained for a project in a year than a month. Put simply, it’s an expected result — you get more unique committers in a year than a month.
Specific effects
The vast majority of projects are tiny, having just 1 or a few contributors. This is even more dramatic than it first appears if you look at the Y-axis, which is logarithmic rather than linear. From the full spreadsheet (embedded below), we can draw some more quantitative conclusions. On an annual level, just over half of active projects (51%) have only 1 contributor, while 19% have 2, 9% have 3, 5% have 4, and 3% have 5 (see the PDF column below). Overall, 87% of projects have 5 or fewer committers per year (see the CDF column). Looking from the opposite perspective, merely 1% of projects have 50 or more committers per year, and a scant 0.1% have 200 or more (see the Rev. CDF column).
Contribution regularity is independent of community size
To directly compare monthly and annual committers, we need to pull the numbers at the level of individual projects and create a plot based on them, rather than looking at two independent histograms on the same graph as we did above. If we do that and aggregate it into 25-project bins to ease visualization, then fit lines to them, we can produce a plot much like the below:
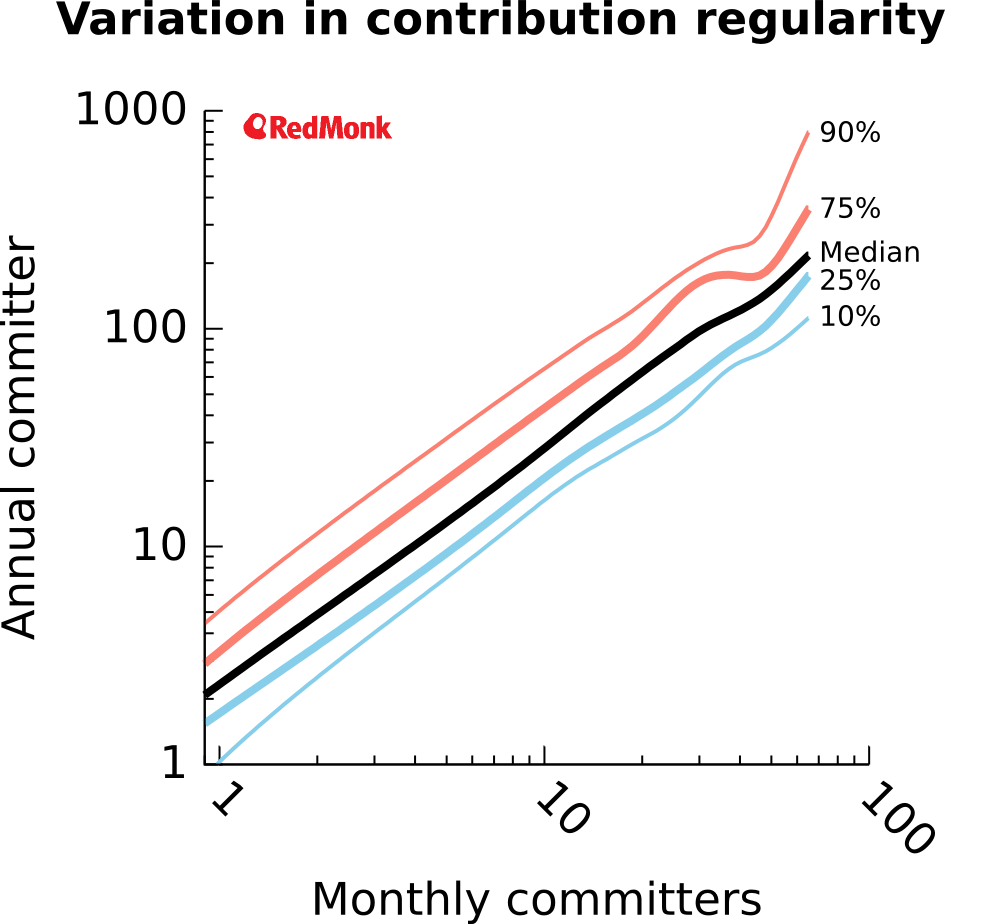
This is a variation on a box plot, showing the median in thick black in addition to a number of percentiles to indicate the size of the distribution cores (25%–75%) and more extreme, non-outlier values (10%–90%). To interpret it, consider that medians represent the central values, while the thicker colored lines represent the “middle half” for each number of committers, and the thin colored lines represent nearly everything (the central 80%).
This plot shows a very clear typical range of annual committers, given a monthly number. Conversely, it could also be read the other way to suggest likely numbers of unique monthly committers, given an annual value.
I next wanted to look more specifically at the relationship between a simplistic prediction of monthly committers and the actual monthly values. It’s based purely on dividing the annual committers by 12 months, which means that a ratio of 1 would equate to each contributor making commits during only 1 month each year.

Interestingly, while the data points distribute much more widely at lower committer counts (potentially due simply to larger populations), it remains near-linear and horizontal, going from a ratio of ~0.20 to ~0.25 as a function of community size. Values below 1 mean committers are making contributions during more than 1 month each year. In particular, if you multiple the ratio by 12 months, you get the average periodicity of someone’s contributions in months — so 0.25 * 12 = committing every 3 months, for a total of 4 months of contributions each year from each committer in large projects, on average, and 5 months from small projects using the same math. While many developers will contribute more, enough will also contribute less to make the final numbers come out around 4–5 months in a remarkably consistent fashion.
An important take-home from this result is that smaller projects are proportionately nearly as likely as larger ones to receive drive-by commits or have relatively inactive developers on a monthly basis.
Larger communities tend to get more engagement
To look for size effects at a finer-grained level than committers alone by looking at commits themselves, I took the ratio of monthly commits per committer and plotted it as a function of community size in the graph below. As the size of a project increases from 1 to ~10 developers, the median gradually doubles from ~5 to ~10 commits per committer, where it then holds steady as community size grows (beyond 20, the data become too noisy due to too few projects of that size).

A number of factors could explain this trend — for example:
- They receive or accept proportionately more drive-by patches that are credited to a committer rather than the patch contributor;
- Everyone is more active due to an effect of community interactions or peer pressure;
- They have a higher proportion of active committers, such as professional contributors who make more frequent commits;
- Most smaller projects will never gain the traction to grow larger, but the larger a project is, the more likely it is to have gained or be in the process of gaining developer traction.
However, the generally horizontal line at the 90th percentile (the peak around 7-8 appears to be an outlier due to some large projects with abnormally low committer levels that month) indicates that a subset of small communities do behave similarly to the larger ones. This suggests that it may be the last of these explanations.
“Post-OSS” licensing practices are a big issue in smaller communities
My eminent colleague James posted this succinct and bluntly honest tweet last fall:
younger devs today are about POSS – Post open source software. fuck the license and governance, just commit to github.
Luis Villa, open-source lawyer and Friend of RedMonk, wrote an excellent post following up on the topic, postulating that POSS behavior was an explicit rejection of permission-based culture. It’s easy to simply accept that this is happening, but as a scientist by training, I prefer to see whether there’s data to support or deny the assertion that licenses as a whole are growing less popular.
Ohloh is quite useful for licensing data because it goes beyond simply looking at COPYING, LICENSE or README files to directly examine the contents of each source file for strings found in licenses. While it’s undoubtedly imperfect because it looks directly for license strings so may miss poorly worded or obscure references to licenses, that will simply set a baseline for detection. Any changes relative to that baseline will still be valuable.
If we look at the percentage of active projects (1 commit in the past year) without licenses detected by Ohloh, it baselines around 20% for large projects, which one would hope embody best practices in open source. This is likely a combination of two factors, Ohloh’s detection ability and actual missing licenses (likely dominated by the former).
But once we start looking at the trends, that’s when things get interesting. Take a look at the graphs below:
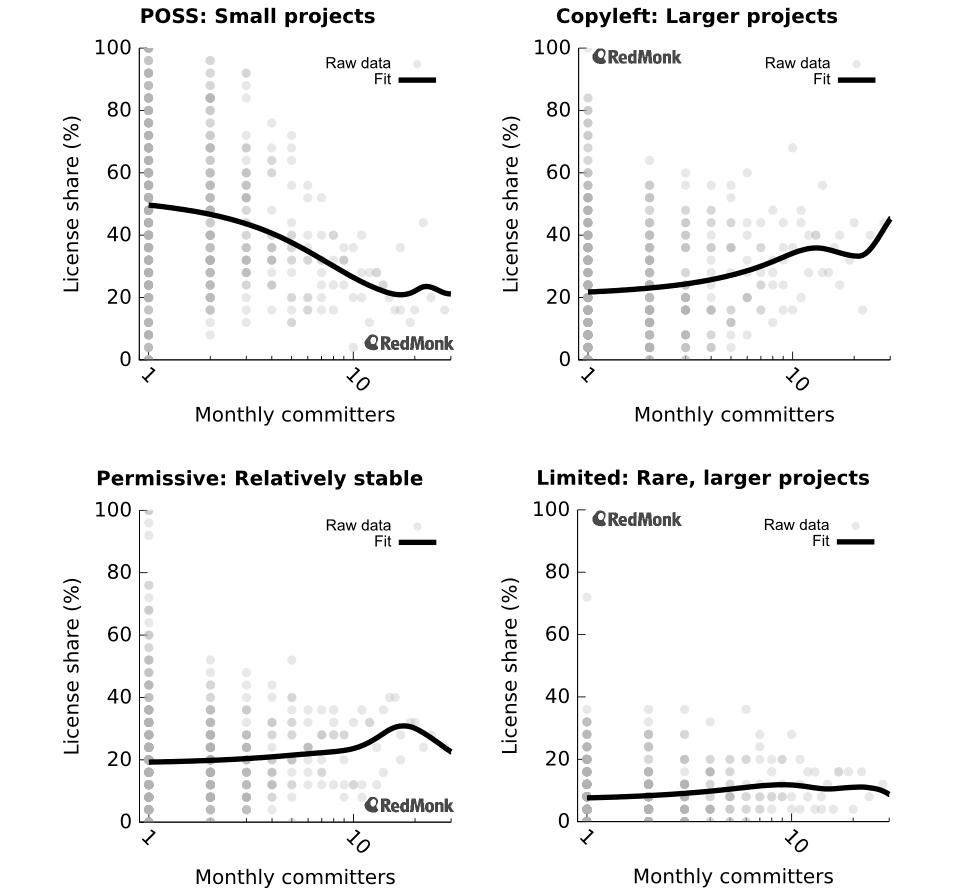
I’ve classified project licensing into one of four categories: None, Copyleft, Permissive, or Limited (a.k.a. weak copyleft). Let’s walk through them in order.
First, unlicensed projects would qualify for the POSS designation and are shown in the top left. This is the largest trend among all of the license types in terms of absolute license share, indicating the importance of thinking about it. When looking at monthly contributors, this trend flattens out around 15 committers at 20% of all active projects and stays flat well beyond the right edge of this graph, to at least 70 commiters per month (after that point it’s too noisy). Regardless of whether this trend is due to a true rejection of the permissive culture, as Luis Villa suggests, or whether it’s a function of lack of licensing education, the shift from 50% unlicensed single-developer projects to below 25% unlicensed projects with 15 or more contributors cannot be ignored. My interpretation is that essentially no projects with ≥10 monthly contributors have licensing problems, while ~1/3 of one-developer projects do. The transition occurs in the middle. In other words, as projects grow, they tend to sort out any licensing issues, likely because they get corporate users, professional developers, etc.
Second, let’s look at copyleft licensing, the next-most-popular type. As a counterpart to the POSS trend, the use of copyleft licenses increases from ~20% to 35–40% around 15–20 monthly committers before the data get too noisy to draw any further conclusions. However, four of the five largest data points (25-project aggregates) hover around 45–50% copyleft, suggesting a potential upper limit that’s driven in part by the Linux kernel and Linux distributions, some of the largest collaborative projects around.
The lower two plots, permissive and limited (weak copyleft) licensing, show mild upward trends on an absolute scale. Permissive shows a small increase from ~20% to ~25%. Limited licenses, on the other hand show a small increase from ~7–8% to ~11–12%. While small on an absolute scale, this modest-seeming trend indicates that limited licenses are roughly 50% more popular in larger communities than small ones.
Hosting providers generally do not support large communities well
The other interesting data point I have is which code forge each active project (1 commit in the past year) is hosted at, so let’s examine the connection between code forges and community sizes. My expectations going in were that:
- Small communities would bias heavily toward GitHub, because it’s basically the center of open development today; and
- Larger communities would likely tend to host independently, because they have more complex needs in terms of service heterogeneity and scale.

Small projects
On an overall level, we can see a strong bias for small projects toward GitHub (~50%), while just under 20% opt for both of SourceForge and Google Code. The remaining ~10% largely choose to self-host, with the last few percent going to Launchpad and Bitbucket.
Two points worthy of note are that GitHub and Launchpad both show global peaks at a committer count higher than 1, indicating a break with the global trend in the first graph that the most common situation is a single-developer project. This could support the importance of a low barrier to entry for collaboration. Getting those first few developers beyond the founder tends to be incredibly difficult, and anything that makes that easier is a huge deal.
Large projects
The downhill trends are clear for SourceForge and Google Code, while Launchpad and Bitbucket appear to remain roughly flat. GitHub seems to have a slight downhill trend. Interestingly, scaling to the needs of larger projects turns out to be a major issue for the older forges (SourceForge and Google Code), but GitHub seems to have largely defeated it.
Conclusions
Once a project reaches 15–20 monthly contributors, it seems to behave much differently, on average, than smaller projects in a number of ways. In larger projects, committers tend to be more active as a whole, licensing tends to be better-determined, and they’re much more likely to be self-hosted. Very small communities make up the vast majority of the open-source world, however, so we need to pay close attention to what’s happening even on solo projects.
Disclosure: Black Duck Software (which runs Ohloh) and Atlassian (which runs Bitbucket) are clients. GitHub and Canonical (which runs Launchpad) have been clients. Dice (which runs SourceForge) and Google are not clients.


What were developers reading on my blog and tweetstream in 2013? – Donnie Berkholz's Story of Data says:
January 6, 2014 at 9:19 am
[…] 1109: The size of open-source communities and its impact upon activity, licensing, and hosting […]
GitHub and Developers: The perils of licensing after code release. « Mirsky & Company, PLLC says:
March 3, 2014 at 5:07 pm
[…] A 2013 analysis of GitHub’s licensing practice by Ohloh revealed that many projects in the site’s repository are made available with little or no associated licensing terms. Upon examination, this makes sense. Slightly more than half (51%) of the projects on GitHub have only one developer committing code on project. As a result, the projects tend to be fairly small. In these instances, the project does not experience the expansive growth and activity that occurs in larger projects with 50 or more active developers who are all committing changes to the master branch. With the lack of outside activity and engagement, the lone developer is less concerned with locking down the code via licensing restrictions, than about developing the project and gaining public attention. […]
The Open Source Urban Legend: Lessons from Heartbleed says:
April 22, 2014 at 10:49 am
[…] that any techie can read or participate in for help on that particular product. The result is a small group of developers actually committing code to enhance the product, and a supersized community of […]
GitHub language trends and the fragmenting landscape – Donnie Berkholz's Story of Data says:
May 2, 2014 at 3:55 pm
[…] and they’re never touched again. This is consistent with my previous research exploring the size of open-source projects, where we saw that 87% of repositories have ≤5 […]
Are we nearing peak fragmentation? – Donnie Berkholz's Story of Data says:
April 2, 2015 at 11:08 pm
[…] Hub (then Ohloh) on all of the open-source repositories they track over time. I’ve written previously on this data, but this time I’m taking a different take and looking more deeply into […]