Have you ever felt utterly out of your element when meeting with your counterparts in the finance or accounting department? If you find yourself lost when discussing financials, here’s a quick primer on some of the key concepts you should be familiar with at a high level.
Financial Statements
Companies invariably have many ways that they assess their financial performance. There are likely many reports that are unique to your organization, but there are core financial statements that a cut across companies and industries.
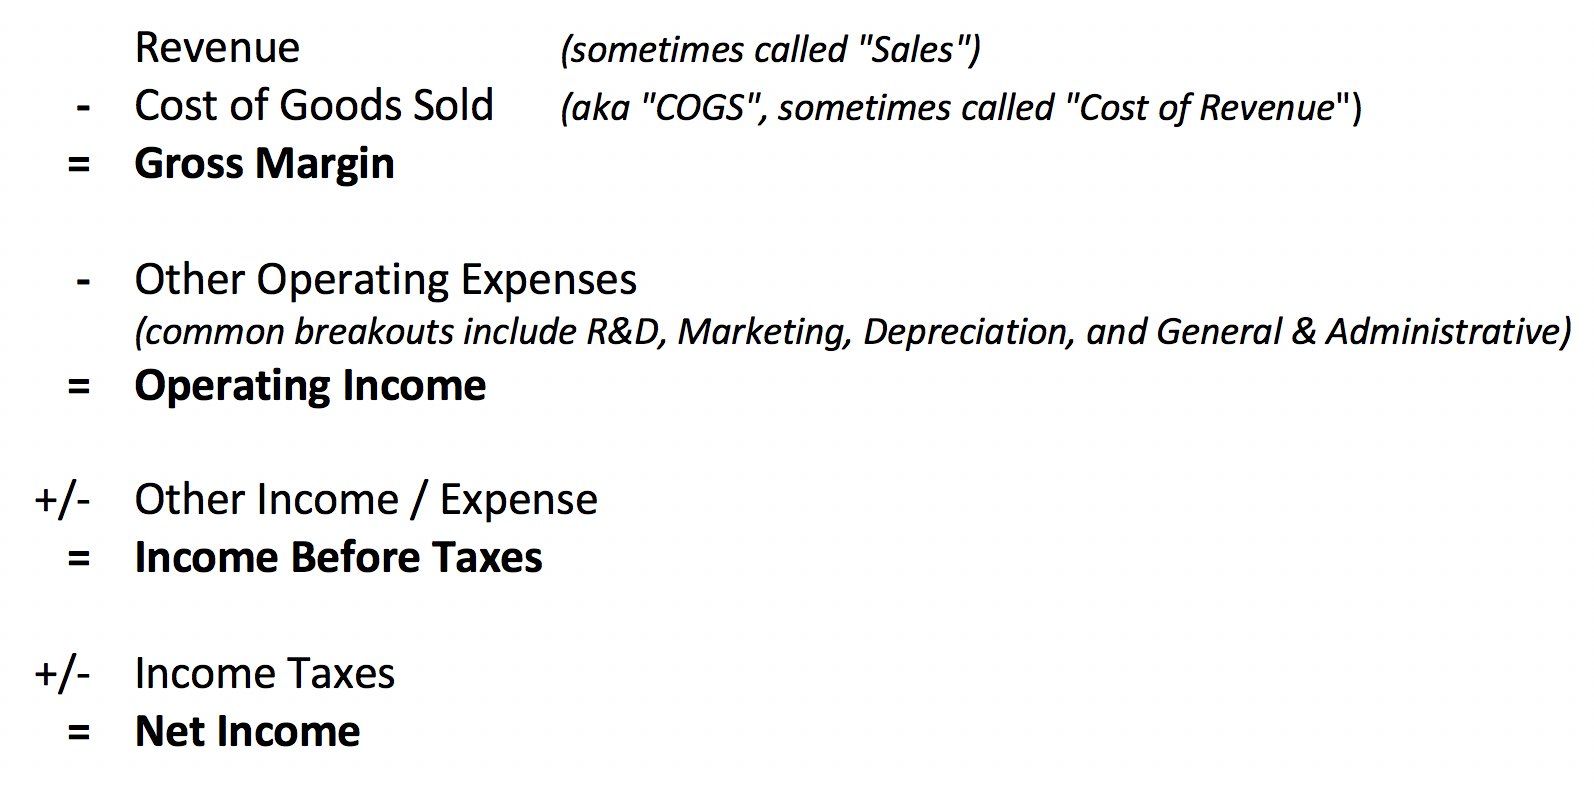
The income statement shows how the company is converting sales into profit over a period of time (commonly a month, quarter, or year.) The goal is to show how much money the company has generated in revenue, how that revenue is being spent, and how much (if anything) is left after all the expenses are covered.
The various line items a company shows may vary, but it looks something like this:
The balance sheet is a snapshot of a company’s financial position at a given point in time (e.g. on the last day of the quarter.) An easy way to think of it: the assets are tools the company has at its disposal to earn revenue, and the liabilities and equity are how the company paid for those assets. Remember that not everything of value to the company is reflected on the balance sheet (for example, see our previous discussion about Data on the Balance Sheet.)
Assets always (always always!) are equal to the total of liabilities plus equity. If your balance sheet doesn’t balance, something has gone very wrong.
Common breakouts would be:
Current Assets
- Cash
- Short-term Investments / Marketable Securities
- Accounts Receivable
- Inventory
- Prepaid Expenses
Long-Term Assets
- Property, Plant & Equipment
- Intangible Assets
- Goodwill
Current Assets + Long-Term Assets = Total Assets
Current Liabilities
- Accounts Payable
- Accrued Expenses
- Deferred Revenue
- Short-term Debt / Current portion of Long-term Debt
Long-Term Liabilities
- Long-Term Debt
- Other Long-Term Liabilities
Current Liabilities + Long-Term Liabilities = Total Liabilities
Equity
- Common Stock (money the company earned by selling shares on the stock market, like in an IPO. Value on the balance sheet is not tied to the current stock price.)
- Paid-in capital
- Retained earnings (the cumulative amount Net Income from the business operations that has been plowed back into the business)
Assets = Liability + Equity
The statement of cash flows shows how cash was spent over a period of time. It is broken down into three sections: operating (cash related to running the business), investing (cash related to things like purchase/sale of assets or M&A activity), and financing (cash related to loans and investments.)
Since we’re aiming to keep this short, I’m going to be honest: of the three financial statements, this is likely the one you’ll care least about from the engineering perspective, so we’re going to keep charging ahead!
What’s Considered Good?
Financial statements are best taken in context, and for the most part there are not universally good or bad numbers. Some things to consider when you look at financial statements:
Ratios between numbers: Some numbers are best considered in relation to other numbers within the financials. Key ratios tend to fall into one of the following categories:
- profitability: how well is the company converting sales/assets/equity to profit? (Common examples are margin ratios (e.g. profit of operating margin) and return ratios (e.g. return on assets or equity.))
- liquidity: how easily can a company’s assets be converted to cash? (The current and quick ratios are relevant measures of closeness to cash.)
- debt: how easily can a company pay its creditors? (The debt-to-equity ratio or the interest coverage ratio are commonly used here.)
- operations: how efficiently is the company using resources to generate sales? (Asset or inventory turnover ratios are frequently used operations ratios. Revenue per employee is another common one.)
- cash flow: how much cash is the company generating? (Free cash flow is one of the best known ratios in this area.)
Trends over time: One of the most telling benchmarks for a company is its own past performance. Comparing financials over time and viewing directional trends is crucial to understanding a business’ trajectory. Don’t just look at absolute dollars. Period-over-period growth and changes in ratios are also helpful. (Beware of seasonality!)
Your company strategy: Different strategies have different impacts on financial statements. For example, companies like Amazon famously have very low profitability compared to their revenue as they plow their earnings back into the business. Some early-stage companies have expenses greater than their revenue while they seek growth. Investor-permissible results are strategy-dependent. What’s okay for one company may not be okay for another; furthermore, what’s okay for one company at a given point of time may not be okay for that same company in a different period.
Your competitors: While no two companies are the same, benchmarks to other companies in the industry can be helpful in understanding what’s common and what’s concerning. Different industries can have very different financial expectations; a result that is great in one sector may be awful in another, so it’s useful to establish comparisons across relevant peer groups.
Key Principles
Matching: The matching principle is one of the underlying tenets of accounting. The essence: expenses are incurred in support of sales, and so accountants try to make sure expenses are reported in the same period as the revenue they support.
Accruals: Very few companies operate on solely a cash basis. If you operated on a cash basis, you would only count revenue upon receipt of funds or expenses when your cash went out the door. Accruals allow a company to separate the financial recognition of an event from the cash payment.
Accruals help support matching. With accruals, you can recognize revenue as it’s earned and you can tie the corresponding expenses to that same period.
Capitalization: Capitalization is a super important concept, as it drives a lot of business decisions. A capital expense is something that drives long-term value for the business, as opposed to an operating expense that is an ongoing cost of running the business. There are rules around what you’re allowed to capitalize, but when it’s determined that something drives long-term value, the company can declare the item asset and it put on the balance sheet rather than the income statement.
Depreciation: Depreciation goes hand-in-hand with capitalization, matching, and accruals. If I invest $1,000,000 in building a data center, I put that $1,000,000 on my balance sheet as an asset. Over time I decrease the value of my asset (because servers only have a limited useful life, so I can’t declare my investment to have indefinite value), and I transfer that decreased value from my balance sheet to my income statement (because the servers impact my ability to run my business every month, we try to match the expense to the general period of time it was utilized.)
Depreciation is a non-cash event (meaning it’s entirely an internal accounting construct, not a physical payment) that decreases an asset’s value and increases an operating expense.
Time Value of Money: Time value of money says that money in the present is worth more than money in the future. This is a core principle of finance.
Imagine I owe you $100. Would you rather have me pay you that money back today or next year? Of course you’d rather have it today. If I want to borrow the $100 until next year, I need to pay you enough interest to outweigh the opportunities you forego by loaning me that $100.
In other words, my willingness to make future interest payments to you grants me the opportunity to use the $100 now; from your perspective, you are willing to loan me $100 in order to receive future interest payments.
Time value of money often comes into play when a company is deciding about projects to invest in. Common measures are Net Present Value (NPV) and Return on Investment (ROI). In each, your goal is is to compare your upfront investment with your projected cash inflows/outflows in future years. The benefits in future periods are discounted both because future dollars are worth less than present dollars and because there is an inherent risk associated with the project.
Things You’ve Heard But Didn’t Want To Ask
Debits and Credits: Debits and credits refer to the way accountants increase and decrease the balances of various accounts. Remember above when we talked about how the balance sheet always needs to balance? The way that’s accomplished is through double-entry accounting, which in practice means each transaction has a corresponding impact on another account. (For example, if you bought a laptop on your company credit card, the computer would be a new tool for the company while at the same time you created a new obligation to pay a vendor. To reflect this, your accountant will increase Assets with a debit and increase Accounts Payable with a credit.)
My advice is to let your accountants worry about which accounts need to be debited and credited, but here are a few guiding principles:
- Assets is always the sum of Liabilities + Equity. No exceptions.
- Debits always equal credits. No exceptions.
- A debit can increase OR decrease the balance of an account, as can a credit. They do not universally mean up or down (in fact they refer to to the left and right sides of the T-accounts); the impact they have depends on which type of account is being debited/credited.
EBITDA: EBITDA means ‘earnings before interest, taxes, depreciation, and amortization.’ This measure it derived from the numbers on the income statement. It is commonly used, but it is not a GAAP-sanctioned financial metric.
If EBITDA is not an official metric, why is it used?
- It can be a useful metric for early-stage companies that aren’t profitable yet.
- When used at a segment level, it tends to reflect the operational elements that are more in the realm of control for line of business managers.
- It’s a relic from time before the statement of cash flow was common, as it’s a quick and dirty approximation of cash flow.
- This is going to sound cynical, but EBITDA shows a better result than the official metric of Operating Profit. EBITDA conveniently ignores expenses related to debt payments, aging assets, and paying the taxman; if you can highlight results that ignore these very real expenses in a way that isn’t going to raise eyebrows, why wouldn’t you?
SOX: SOX-compliance refers to the Sarbanes-Oxley Act that was passed after Enron. If you’re having a SOX conversation, it’s almost certainly around maintaining, establishing, and/or verifying internal controls. Other key provisions of the law include requiring all top executives to certify to the veracity of financial results and maintaining independence of auditors and analysts.
“Rev-rec”: aka revenue recognition. This is the determination of when a company can count revenue as earned. This is a lengthier topic than we can cover in 5 minutes, but there have recently been changes to the revenue recognition standards, which makes this a particularly hot topic of late.
Gross vs. Net: “Net” refers to an account after adjustments have been factored in. For example, Gross Sales refers to your total revenue, and Net Sales takes that total revenue number and subtracts out things like refunds and returns.
If you have a hard time keeping track of which is which, remember them alphabetically: G comes before N, gross occurs before net.
Variance analysis: Typically this refers to comparing actual results to what you projected in your budget. If someone asks you to assist with variance analysis, it’s helpful to know:
- The biggest deviations from budget in absolute dollars.
- The biggest deviations in terms of percentages.
- Whether your differentials were related to cost or volume. (If you expected to be charged $3.25/per million API calls and it actually costs $3.50, that’s a cost variance. If you expected to make 20 million API calls and you actually made 200 million, that’s a volume variance.)
I hope this helps you approach cross-team collaboration with confidence! Shoot me a message or leave a comment if there’s a financial/accounting concept plaguing you that I failed to cover above!
No Comments