
brief discussion around some interesting numbers in the news
51%
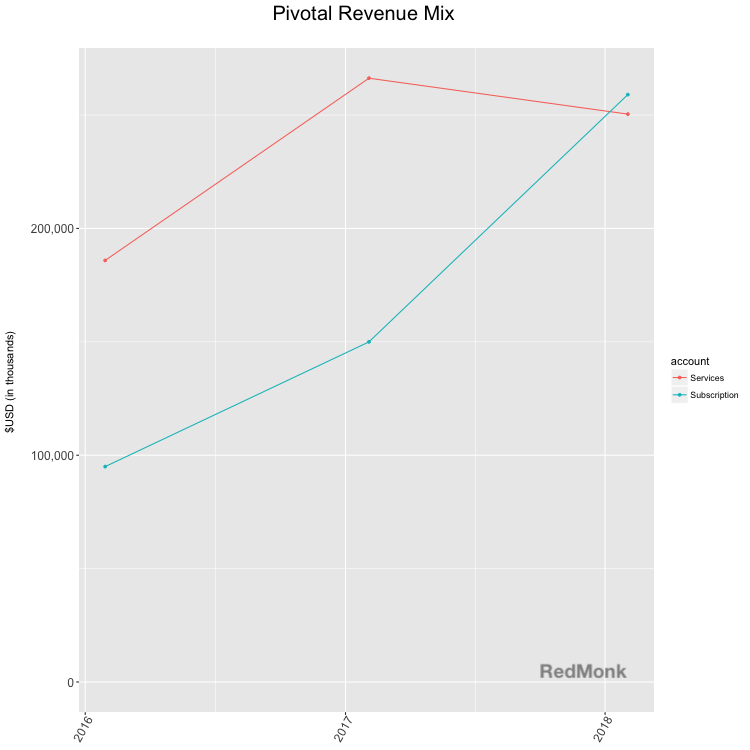
Pivotal IPO’d on April 20, raising $555M. A view into their operations as outlined in their S-1 filing was of particular interest.
Pivotal’s latest annual revenue topped half a billion dollars, with 51% coming from software subscriptions. Over the past three years, the relative mix of revenue stemming from services provided by Pivotal Labs is declining as compared to revenue stemming from PCF subscriptions.
What’s to make of this shift? The S-1 discusses the synergy between customers that have used Labs services and those that have PCF subscriptions, where “customers who have used Labs expand their PCF usage 1.5x more than those who have not used Labs.” However, the Labs experience drives more than just increased software sales. Last year my colleague Steve wrote:
“Today, many Java shops are at a rare inflection point. They have massive existing Java investments, but understand that whether they leverage the public cloud or merely attempt to compete with it, the infrastructure their applications live on is going to either be cloud or look like one. Pivotal’s co-opting of the “Cloud Native” term provided these Java-based enterprises with a modern path to aspire to. More important than vision, however, is Pivotal’s ability to work side-by-side with customers’ development staffs in an effort to teach them what they need to get themselves there. Many vendors can sell software; comparatively few vendors can sell a modern development organization.”
Pivotal Labs sells the promise of modern software development to their customers, but these services are in framed as being in support of software subscription sales. The S-1 overview explicitly states “we are focused on subscription sales of our platform.” In piecing together revenue trajectory and strategy, it seems evident that the focus is using Pivotal Labs services revenue as a driver for PCF subscription revenue.
Profitability adds another layer to the story. Pivotal is not yet profitable; their last three years of net losses total to $679M. The $555M influx from the IPO provides some working capital cushion, but the revenue shift is also helpful in their move to profitability. The S-1 breaks down the cost of subscription and services revenue, so we have a view into margins for each business line. In 2017, subscription operating margin was 88% compared to 21% for services.
Pivotal is in the process of leveraging their high cost area of the business to drive sales in their low cost area. While this is not a novel storyline, the balance the company strikes will be especially relevant given the crucial role Pivotal Labs plays in their customer narrative. Watching to company find the synergies between Pivotal Labs and PCF will be an interesting aspect of viewing their journey as a public company.
$2,000,000,000-ish
Amazon announced increased prices for Prime membership. Annual membership will increase from $99 to $119 ($49 to $59 for students). Additionally, in his 2018 shareholder letter released earlier this month, Jeff Bezos revealed that Amazon has “exceeded 100 million paid Prime members globally.” This is the first time Amazon has officially released Prime membership statistics.
Combining these pieces of news has led several people to the following back-of-the-napkin calculations about the expected impact of the price change on Amazon’s revenue:
Amazon raising Prime price by $20. Multiply that by 100 million users and you get oh, an extra $2 billion in yearly revenue presumably without much increase in marginal cost. (Back of envelope; not everyone pays full price and some may cancel because of the price increase.) $AMZN
— Nate Becker (@natebecker) April 26, 2018
I read this and instantly felt pedantic; “those caveats at the end matter! Price elasticity and customer mix are important elements of this calculation!” And thus I began my own back-of-the-napkin math that ended up in roughly the same place. So yes, $2B is a reasonable assumption of revenue impact, but in case you’re curious, here’s the journey of a curmudgeonly skeptic:
Issue 1: inelastic demand
Inelastic demand means that a consumer’s willingness to purchase a product is not impacted by changes in price; suppliers of inelastic products can raise their prices without impacting how many people are willing to buy it. Inelastic products tend to be “necessities” (like gasoline) that at least in the short-term are difficult to substitute for other products when the price changes. Few goods are purely inelastic, so the question at hand is “to what degree is Amazon Prime elastic or inelastic?”
Alas, this is not something we can estimate with any degree of certainty. Anecdotally, we have a new baby at home and rely heavily on Prime for keeping the house stocked these days; in all honesty our household demand probably approaches inelastic at the moment, but that’s definitely not a safe assumption to make across an entire population. A good estimate needs to assume some churn in the subscriber base.
But since churn statistics are definitely not available and the goal is to do this back-of-the-napkin, I ultimately made peace with the fact that this part of the equation is unknowable. Churn will remain a caveat in my estimate as well.
Issue 2: customer mix
To feel comfortable with the estimate as calculated above, we’d also need to feel comfortable with the estimate that $20/year is a good approximation of overall price increases across the subscriber base. And that seems like a fraught assumption about customer mix. This goes beyond not knowing the mix of standard and student memberships. There are also monthly subscribers, whose rates were already increased in January, from $10.99 to $12.99 (and $5.49 to $6.49 for students). Additionally there are Prime Video subscribers and monthly subscriptions for those on government assistance whose prices for now are not impacted. On top that, this is all a U.S.-based view of subscribers; that 100M subscriber number is global, which means you have to both factor in international customer mix as well.
Given this variety of subscription options, there is a wide range in the possible price changes (from a $10/year change for monthly student rates on the low end of price changes to $24/year for monthly subscribers on the high end). If we assumed a base of all monthly students (a bad assumption) that would create a revenue increase of $1.2B; if we assumed all monthly subscribers (again, a bad assumption), Amazon would have a revenue increase of $2.4B. The answer obviously lies somewhere in the middle, but narrowing down that window between $1.2B and $2.4B requires estimating the mix of subscribers between all these categories. This exercise that is fraught with estimation error.
But what if we view the change from a percentage perspective? All categories of monthly and annual subscribers saw 2018 rate increases between 18% – 20%. Using the percent change in the price and applying this to Amazon’s total subscription revenue should in theory give us a much narrower estimated range without requiring any additional knowledge about the subscriber mix.
I looked up the 2017 Subscription Services revenue from the Amazon 10-k ($9.7B), applied the ~20% increase and calculated my estimate: the expected subscription revenue impact of Amazon’s recent price changes came out to (drumroll!) $1.8B – $2.0B.
This estimate still doesn’t include churn and is probably still heavy on the percent increase given it does not include Prime Video / government assistance / international subscribers, so I would expect the impact to land on the lower end of the range. That said, $2B is decent ballpark figure.
In conclusion: sometimes it’s okay to trust other people’s back-of-the-napkin math.
Disclosure: Pivotal and AWS are RedMonk clients.
Image credit: Flickr/morebyless under CC-BY 2.0
No Comments