Cloud is a seemingly omnipresent competitive force that is shaping the industry landscape. As Steve wrote in The New Kingmakers, “for all of the focus on the technology of cloud computing, its real import has been the elimination of up-front capital expense costs and making any class of hardware instantly accessible.” The advent of cloud computing and IaaS models have transitioned consumer costs from capital expenses to operating expenses, offering a pay-as-you-go pricing model in lieu of large upfront equipment investments.
In exchange for these monthly payments, the capital expenses previously borne by customers were shifted to vendors. While vendors are able to achieve much greater economies of scale, the underlying expense to build data centers remains immense.
If we proceed from the logic that investing in data centers is integral to the success of cloud providers, who has been making these investments to date and who has the capacity to make them in the future?
The Secretive Nature of Infrastructure Investments
Chris Sacca was recently a guest on Bill Simmons’ podcast and provided some insight into the clandestine infrastructure strategies of cloud providers. At one point Sacca was in charge of building out Google’s data centers with a billion dollar budget, but everything transacted under the The Salinger Group name instead of Google because according to Sacca, “if you know how much data center capacity a company has, you can infer from that how big they are.”
Given that companies closely guard any direct insight into their data center capacity, perhaps we can reverse this logic to use information about size of companies (based on publicly available financial metrics) in order to make inferences about their ability to compete in the cloud market.
Caveats
There are some fairly significant caveats to using publicly available data for this analysis. The most notable is that nearly all of these companies have other major lines of business that obfuscate the impact of their cloud strategy in their consolidated financial statements.
However, we do know that the process of building out data centers is capital intensive, and these sizable investments are generally encapsulated within the balance sheet as a long-term asset under property, plant and equipment (PP&E). 1
Company executives have provided some insight about the nature of their PP&E investments on their earnings release calls. Microsoft CFO Amy Hood commented in the April 2016 call that the company’s 65% year-over-year increase in capital expenditure spending was “primarily for data centers and servers” and that same quarter, Amazon CFO Brian Olsavsky similarly noted “these capital expenditures and capital leases reflect additional investments in support of continued business growth due to investment in technology infrastructure, the majority of which is to support AWS.”
The two major players in the cloud market, AWS and Azure, are making substantial PP&E investments, and both Amazon and Microsoft have acknowledged that their overall company capital expenditures are primarily dedicated to expanding data center capacity. Where do other vendors stand compared to that benchmark?
We are going to use PP&E to explore how companies may be investing in cloud infrastructure, but we make no assertion that the PP&E figure encapsulates all of a company’s cloud investments or that cloud infrastructure comprises the entirety of a company’s PP&E spending. This is merely an attempt to extrapolate information about cloud data center investment strategies using the limited data sources available.
PP&E Investments in Cloud Infrastructure
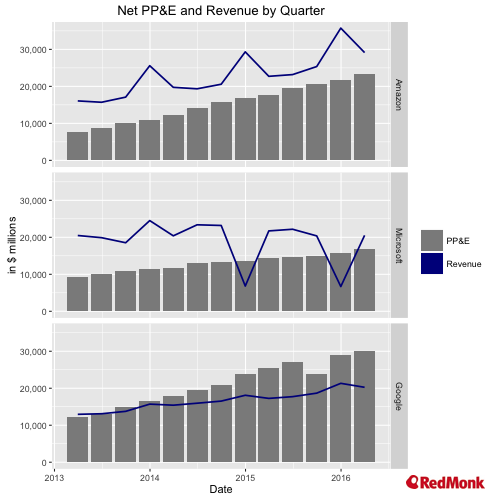
We begin by looking at PP&E and revenue trends for what are commonly regarded as the three major competitors in the market: Amazon, Google and Microsoft.
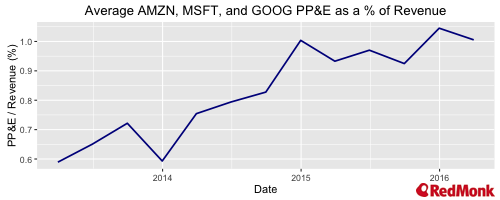
This chart, in turn, looks at PP&E as a percentage of overall revenue over a multi-year period.
A few observations:
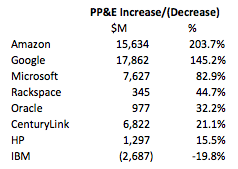
- Over the past three years, Amazon, Microsoft, and Google have invested billions into expanded infrastructure. In order of relative magnitude, the value of Amazon’s net PP&E has increased by 204% ($15.6B) since 2013; Google’s increased by 145% ($17.9B) and Microsoft’s by 83% ($7.6B).
- The average ratio of PP&E to Revenue has climbed from under .6 to over 1.0 in this time period. Note that proceeds from sales are not the only method for funding asset acquisition, but they are probably the most straightforward method of subsidizing investments. This comparison is not intended to indicate that revenue is directly funding PP&E (for example, companies can and often do use debt to finance capital expansion projects), but rather is intended to compare how infrastructure investments are growing relative to revenue inflows from business operations.
- Based on this ratio, Amazon seems best poised to continue using business revenues to subsidize its PP&E expansion efforts.
With the above in mind, let’s examine how a selection of other would-be cloud players compare to the Big Three.
How do other vendors compare? 2
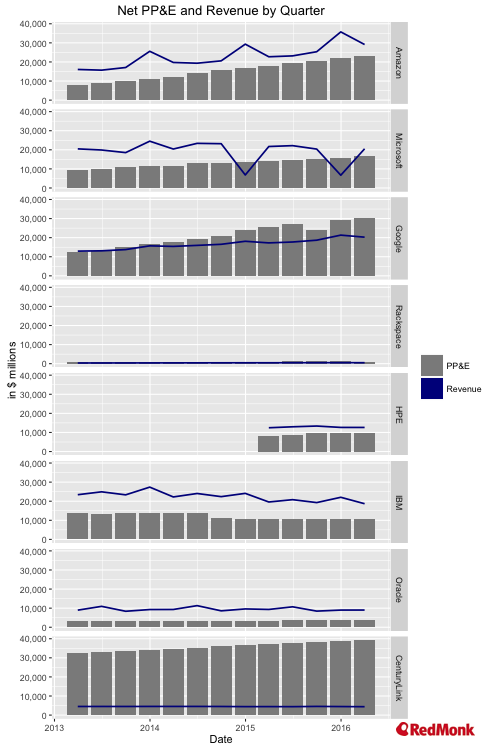
There are some striking differences when comparing these competitors with the core cloud providers above. For the most part (with the notable exception of CenturyLink), these vendors have significantly fewer PP&E assets on their books. The average of Amazon, Microsoft, and Google’s PP&E as of 3/31/16 was 45% higher than the average for the remaining vendors (and 73% higher when CenturyLink is excluded.) Also, the growth in PP&E investments since 2013 amongst this group is comparatively anemic.
Notes about the outliers:
- CenturyLink has made great strides in their attempt to pivot to a cloud business model. However, their core businesses in fiber/telephony/TV are capital-intensive and fixed cost-dominated. The ratio of CenturyLink’s PP&E to Revenue is almost $9:$1, significantly greater than all other vendors in this analysis.
- Though their ratio of PP&E to Revenue is relatively in line with their competitors, the relatively small size of Rackspace’s equipment investment and revenue are notable. Rackspace is included here not because they purport to be competitive with large-scale cloud players – the company has been transparent about its pivot to support of infrastructure rather supplier of it – but rather as an illustration of the degree of change in this market. At one time, Rackspace was one of the largest suppliers of hosted and managed infrastructure. Today, it’s investments today are dwarfed by its larger competition.
Finally, let’s examine the yearly increases/decreases in PP&E across companies.
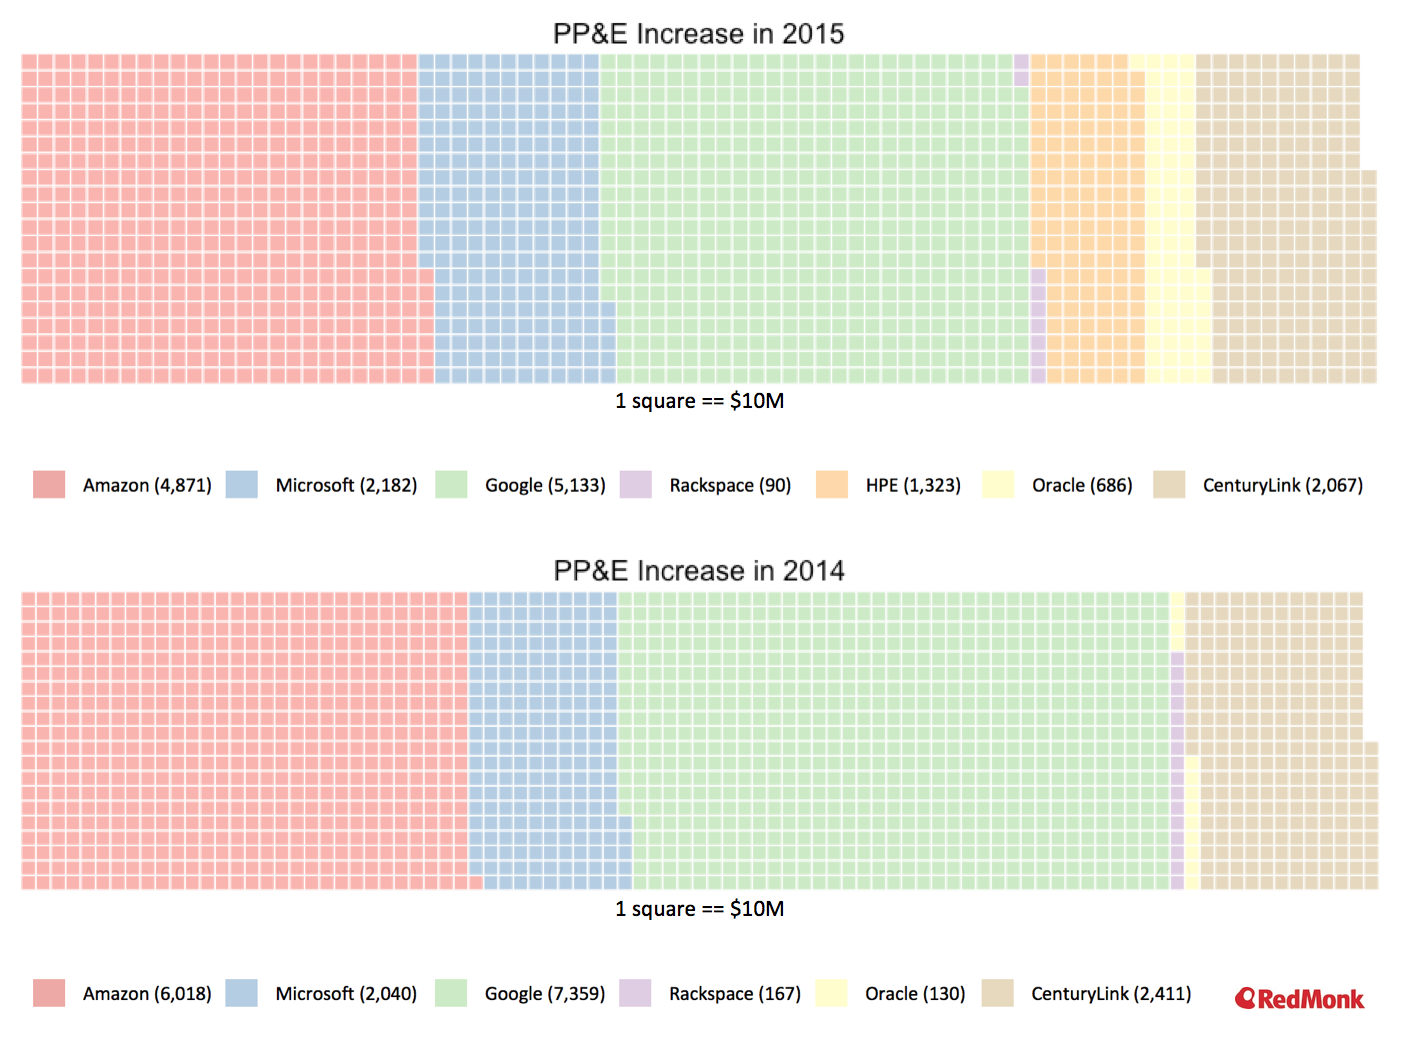
The above waffle charts show how net PP&E balances have changed for each company over the past two calendar years. These are less useful for tracking changes over time but are helpful for comparing PP&E increases relative to one another.
As before, HPE data is limited to the time after its split from HP. IBM is also notably absent from these graphs, as they experienced PP&E decreases in each year. In 2015, IBM’s PP&E balance declined by $44M and in 2014 it decreased by $3.05B.
Key Takeaways
Competitiveness in the cloud market is largely reliant upon companies’ infrastructure investments. More specifically, given the size of the investment required it should be increasingly possible to infer actual competitive intent from the balance sheet in ways not possible in other technology markets such as software. Examining PP&E investments compared to sales is one view that could be indicative of a company’s capacity to support data center build outs. It will be interesting to watch how future capital investment trends affects competitive positioning amongst this cohort.
From this perspective, AWS, Azure, and Google Cloud are all likely to remain well-situated to compete in the cloud market. They have already made sizable PP&E investments and also have incoming revenue streams to subsidize further data center expansion. The trajectory, size or both of competitors’ PP&E spend, meanwhile, raises questions about the number of serious participants the public cloud market can reasonably expect moving forward.
Disclosure: Amazon, Microsoft, IBM, HPE, Oracle, CenturyLink, and Oracle are RedMonk customers. Google and Rackspace are not currently RedMonk customers.
- It’s possible to keep investments off the balance sheet by using lease accounting, where instead of acquiring an asset outright a company can instead treat equipment as a rental. In those instances, any equipment costs would show up as periodic payments that flow through the income statement rather than being reflected on the balance sheet. Companies are definitely using this accounting technique for a portion of their data center investments (see Olsavsky’s reference to capital leases above), though for this analysis we’re going to exclusively examine PP&E on the balance sheet. ↩
- This is not intended to serve as a comprehensive list of cloud providers, but rather a view of some of the major vendors competing in the space. Note that Hewlett Packard Enterprise data begins 3/31/15; data before that is either incomplete or unavailable due to the spin off from HP. ↩
Steve Chambers says:
June 17, 2016 at 3:13 pm
Excellently concise and informative, puts into pictures and words what we’re all thinking! Thanks.
Go Big or Go Home - Packet Pushers - says:
June 25, 2017 at 7:10 pm
[…] Stephens from RedMonk published an analysis last summer that uses information about size of companies (based on publicly available financial […]