In March of last year, spurred by in part by a high volume of requests, we examined a few of the community metrics around the configuration management tools Chef and Puppet. Not intended as a technical comparison, it was rather an attempt to assess their traction and performance relative to one another across a number of distinct communities. At the time, there was no clear winner or loser from the comparison.
An interesting thing has happened since we ran those numbers, however. In the interim, two new projects have emerged as alternatives that we’re encountering more and more frequently in our conversations with and surveys of various developer populations.
While it is true that there are a number of open source configuration management tools besides Chef and Puppet, those have commanded the majority of the attention in the category. But increasingly, and in spite of the relative maturity and volume usage of both Chef and Puppet, Ansible and Salt are beginning to attract a surprising amount of developer attention. Where it once was reasonable to conclude that the configuration management space would evolve in similar fashion to the open source relational database market – i.e. with two dominant projects – that future is now in question. Certainly that remains one possible path, but with the sustained in interest in alternatives it’s now worth questioning whether configuration management will more greatly resemble the NoSQL market – which is characterized by its diversity – than its relational alternative.
Because there has been no clear winner in the Chef/Puppet battle and because there are two new market entrants, then, it is not surprising that we’ve been fielding a similar volume of requests to compare the projects across some of the same community metrics as we did a year and a half ago. Here then are how Ansible, Chef, Puppet and Salt compare with one another within various developer related communities, open job postings and more.
Debian
Before we get to dissecting the charts, a word on Debian usage. Per a conversation with Jesse Robbins last year following the original Chef vs Puppet analysis, it should be noted that installing via the Debian package management system (apt) – what’s reflected in this chart – is not the preferrred installation method for Chef (gems is). This means that Chef will be under-represented in these charts. Salt, meanwhile, provides installation instructions for Debian that leverage apt and Ansible’s documentation explicitly recommends installation via operating system provided package management systems. One other caveat: while there are in some cases multiple packages for the individual projects, this analysis only includes the most popular for each.
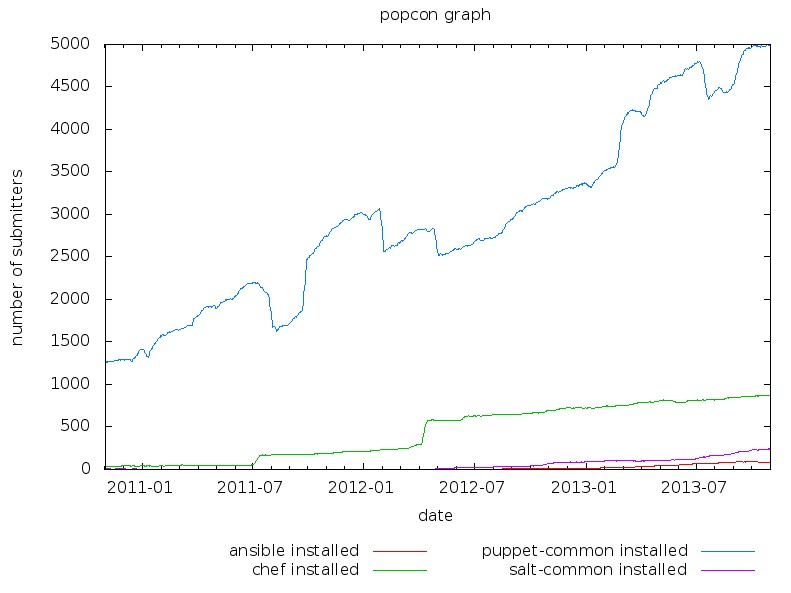
While this is useful for communicating the dominance of Puppet in terms of installations via Debian packages, the chart obscures any other useful information on trajectory.

If we grant that Puppet leads in this context however and subtract it, it’s easier to perceive the growth of each platform. Chef is outpacing the other two projects, while Salt enjoys a moderate lead on Ansible. It’s possible that Ansible’s performance here is related to its close ties to the Red Hat ecosystem; it ships by default in Fedora and is available on RHEL via EPEL. Surveying the distribution on that ecosystem would be interesting, were data available.
GitHub
GitHub offers a variety of metrics about the projects it hosts. For our purposes here, we’ve chosen the number of times a project has been forked, the number of pull requests accepted over the last 30 days and the number of times a repository has been starred. This is intended to assess, among other things, project activity and developer interest.

Superficial though the signal of a GitHub star may be, it is interesting nevertheless to see Ansible outperforming Salt and Ansible and Salt both outperforming the better known Chef and Puppet.

The leadership of Ansible and Salt within the pull requests, meanwhile, was predictable. As more older and more mature projects, it’s natural that Chef and Puppet would see a lower rate of pull requests. It’s interesting to note, however, that Ohloh shows a much higher number of all time contributors for Ansible (559) and Salt (661) than Chef (331) and Puppet (332). GitHub doesn’t concur with those numbers precisely, but does show a similar disparity in terms of contributor volume.

In terms of the number of times each project has been forked on GitHub, the numbers are closer, but still advantage Ansible. Chef is forked slightly more often than Salt, which in turn is more widely forked than Puppet.
As far as we can tell from these rough GitHub metrics, then, developer activity within the new market entrants signals them as projects to be watched closely.
Hacker News
Within the Hacker News community, the metric is merely mentions of the individual technologies plotted over time. Unfortunately, plotting with ‘Salt’ points to an issue with the metric.
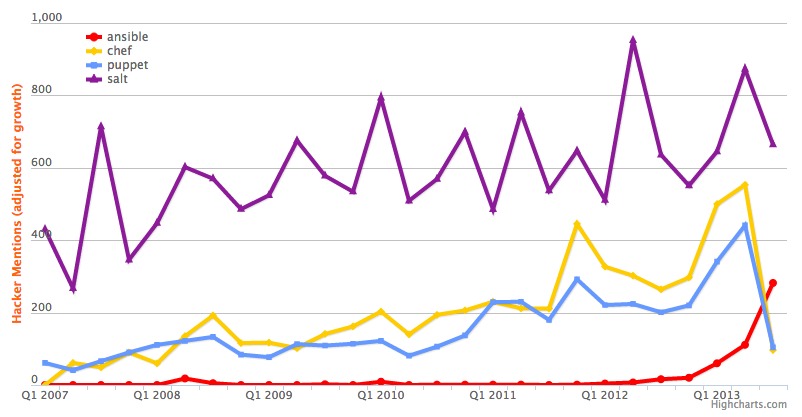
Not only does its performance on this chart wildly outperform expectations, the mentions predate the actual existence of the project by some four years. Clearly we’re dealing with artifacts then, recording mentions on “salting” password databases and the like rather than strictly mentions of the project. If we instead query using SaltStack, the results look slightly more reasonable.

It’s necessary to note that this disadvantages Salt in that the ‘SaltStack’ query will omit some legitimate mentions of ‘Salt,’ but that can’t be helped without a Google Trends-style topical understanding of the subject matter. In the meantime, the results are more or less in line with reasonable expectations. Chef and Puppet outperform their younger counterparts, particularly when the latter hadn’t yet been created, and appear to maintain a substantial edge in overall mentions – although Ansible has been spiking this year and may be currently competitive in terms of discussion volume.
Indeed.com
In terms of job queries, we run into similar issues as above. Chef and Salt massively outperform the other two projects, in part because they reflect jobs other than those working on these tools. If we attempt to subset the data we’re looking for, adding ‘technology’ to the query to restrict our search to technology jobs only, we still have issues with Salt and thus are forced to omit them, but have somewhat more reasonable looking data for the other three.
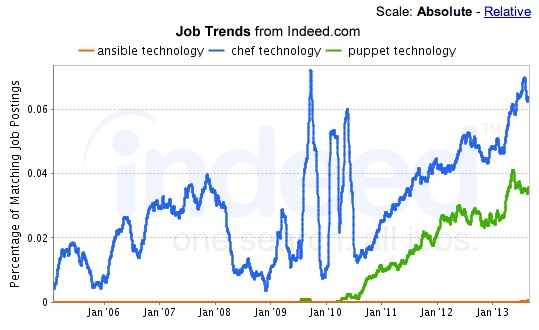
In terms of the absolute number of jobs, both Chef and Puppet are massively overrepresented relative to Ansible as would be expected. Chef’s lead over Puppet is clearly somewhat artificial, as its traction dates back to 2006 while the initial drop of the project was in 2009. But in general, it seems reasonable to conclude that Chef and Puppet offer a higher volume of jobs at the present time than either Ansible or Salt.

In terms of their relative performance, rather than the absolute number of jobs, the most notable feature of the chart is Puppet’s rapid and sustained growth. Ansible looks to be growing, but not nearly at the rate that Chef and Puppet are.
In another counting statistic, meaning that time is a factor, the relative membership rates of LinkedIn user groups were no surprise.

Ansible and Salt were substantially outperformed by both Chef and Puppet. Interestingly, however, Puppet dominated not only the two newer projects but Chef as well. It’s difficult to say, however, whether this genuinely represents an advantage in traction for Puppet’s community, or whether it’s another artifact: this time of the low discoverability of Chef’s user group. Simply entering Chef turns up pages of cooking related user groups; would be members have to begin their LinkedIn query with Opscode to turn up the user group they’re looking for.
Stack Overflow
To examine the Stack Overflow dataset, this script by Bryce Boe was used to examine the performance of two of the selected projects by Stack Overflow tags by week over a multi-year period. Ansible and Salt did not generate high enough returns to be plotted here.

While Chef comes out slightly ahead, the correlation between questions tagged Chef or Puppet is strong, with neither taking a commanding lead. Importantly, however, the trajectories for both is upwards, if uneven. To get a sense of how all four projects compare in a snapshot, the following chart depicts the tag volume for each project.
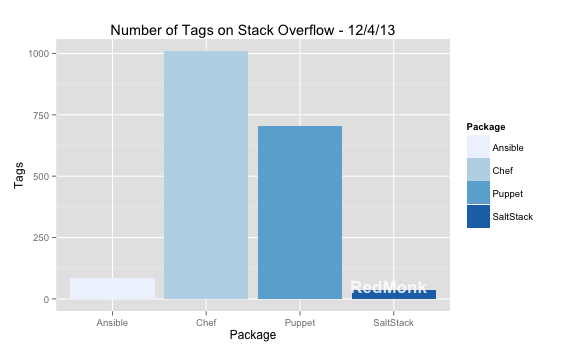
To no one’s surprise, Chef and Puppet have generated substantially more questions over time than either Ansible or Salt – if only because they are older projects. Notable in addition to this, however, is Chef’s lead over Puppet. This is interesting because Puppet’s initial release was in 2005, four years before Chef became available. To be fair, however, Stack Overflow itself was only launched in 2008, so it’s not as if Puppet could capitalize on its first to market status with traction on a site that didn’t yet exist. Apart from Chef and Puppet, Ansible (84) demonstrates marginally more traction than Salt (37), but the total volumes mean the importance of that difference is negligible.
The Gist
What do we take then from all of these charts, with all the mentioned caveats? Most obviously, the data suggests no clear winner of this market at the present time. It indicates greater existing traction and usage for Chef and Puppet, of course, but this is to be expected given their longer track record. Even narrowing the field to those two projects, neither holds a position of dominance as judged by these metrics.
The most interesting conclusion to be taken from this brief look at a variety of community data sources, however, may well be the relevance of both Ansible and Salt. That these projects appear to have viable prospects in front of them speaks to the demand for solutions in the area, as well as the strong influence of personal preferences – e.g. the affinity for Salt amongst Python developers. Neither of the newer market entrants is remotely competitive with the incumbents in terms of counting stats, but they are more than holding their own in metrics reflective of simple interest.
How this market evolves in the future is still unclear, as few projected it to be more than a two horse race as recently as a few years ago. But while Chef and Puppet continue to sustain growth, it is likely that they’ll be facing more competition over time from the likes of Ansible and Salt.
Disclosure: Ansibleworks is a RedMonk customer. Opscode and Puppet Labs have been RedMonk customers, but are not currently. Saltstack is not a RedMonk customer.

Recent Comments