“Ideas come from data.” – Steven Levitt, author of Freakonomics
We built RedMonk Analytics a year ago to provide the best source of developer trends in the world. We began by starting with what we controlled, mining our own data byproducts for insight. Having published thousands of articles on developer related topics over the past nine years, we built a system that watched what developers did with same. This data we then filtered for noise, mined it for patterns, then served it up to our users.
Our typical user is someone intent on better understanding what what developers were interested in and asking about, in answering questions like “How popular is Node.js, really?” While we’ve incorporated in a variety of third party data sources, however, from Infochimps’ Trstrank data to Del.icio.us and Twitter metrics, RedMonk Analytics has been primarily about the data that we generate. Or more accurately, the data our developer audience generates by interacting with us.
That RedMonk-heavy data bias ends today. With our latest and biggest RedMonk Analytics feature drop to date, we are now able incorporate data from any source, provided it can be formatted as a spreadsheet.
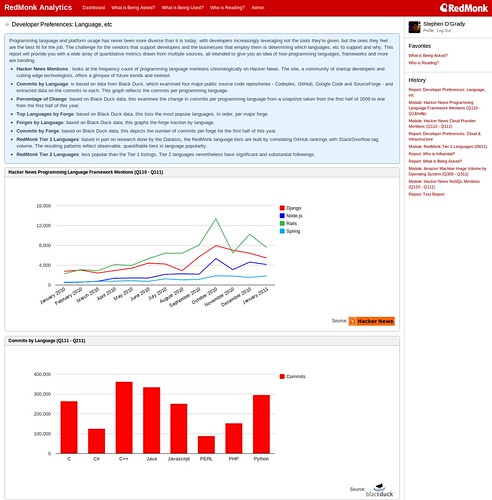
Some of the data currently pouring into the system comes from our own research; it’s information that we have curated or collected from outside sources. Examples include programming language framework traction taken from the data mining we’ve done on Hacker News, or our programming language tiers that are based in turn on GitHub and StackOverflow statistical correlation analysis we did. Or maybe it’s just presenting research and development costs for technology vendors.
But we are also hard at work inserting data obtained directly from commercial and non-profit third parties like Black Duck and the Eclipse Foundation.
RedMonk Analytics is about providing you with the best possible picture of developer wants and needs; and if you want to do check the source for more detailed investigation, everything’s attributed, branded and linked. Which is why more and more commercial organizations are talking to us about the data they have that they’re not using, how to begin leveraging it and what they’d like to share with us.
For our users, present and future, we hope you enjoy our ever expanding library of developer related datasets. This should help you make better decisions, whether you’re in marketing, strategy or are a developer trying to make the case for a preferred technology. We’ve got data in here on everything from Flash vs HTML5 to cloud platform traction to programming language commit histories.
If it’s about developers, we either have it, or we’ll do our best to get it.
What’s in it for Users?
We believe that we’re building the most complete, quantitative source of developer related trends and behaviors anywhere. So to the extent that you care about what developers are doing, this product should interest you.
RedMonk Analytics will be continually adding new data sources from our research and from third parties, ensuring that the developer picture gets ever better and more comprehensive over time. Some data will give you historical perspective; other sources will be up to the minute.
All will help you make better decisions in your technical strategy, your developer engagement, your community and partnership strategy and your business. Interested in subscribing? Ping us analytics @ redmonk.com.
What’s in it for Data Partners?
Black Duck is a perfect example of how we work with commercial data partners. Black Duck is in the business of providing management and governance services around open source software. They are not, generally, in the business of mining their data for insights about developers generally. They are, however, possessors of a wealth of related data. And while Black Duck’s not in the business of developer research, we are.
Which is one area in which we’ve been working with the company, helping to glean insights from their their data, the output of which has been projects such as our joint webinar.
From Black Duck’s perspective, then, we’re taking interesting little snapshots of their data, which help round out our developer picture, showcasing all of the interesting data that they have at the same time. Throw in the fact that RedMonk Analytics is effectively another channel for them, and it’s the basis for a good relationship.
Have interesting data, and want to know more? Great, we’ve got the slides for you.
What this means for RedMonk
When James and I founded RedMonk in 2002 – that’s right, we’ll be ten next year – we made the conscious decision to “not do” numbers. Not because we didn’t want to, but because we didn’t think that anybody had good numbers about the audience we cared about – developers – and their tools. It was relatively easy to determine how many x86 servers Dell shipped per quarter; it was – and still is – impossible to tell how many times MySQL was downloaded in a given day.
But over the past few years, we’ve been able to increasingly tap into a variety of data sources that serve as a proxy for measurement. We might not be able to tell you how many times MySQL’s been downloaded in a given year, but we can tell you how frequently it’s being discussed relative to alternatives in a given community. And so on.
This is, as far as we’re concerned, the future: blending high broad and diverse quantitative data analysis with our traditional qualitative advice. This is why I went back to school to learn statistics, why we optimized for this training in our hiring process, and why we built this system for us and for you.
This is the new RedMonk, where we heart data. If you do too, we should talk.
