I still remember the day in 8th grade when we learned about oxymorons in English class. It was a great day. It wasn’t just the glee of gaining sanctioned use for previously verboten classroom language (“oxyMORON!”); the process of brainstorming phrases comprised of inherently contradictory terms proved to be an amusing activity. We worked our way through the common examples like ‘jumbo shrimp’ and ‘deafening silence.’ Then we discovered that you could create snarky oxymorons.
All of which is to say: let’s talk about the business intelligence market.
What’s Old Is New
Data representation is not new. People have been tabulating, displaying, and quantifying things for centuries.
In the 17th century René Descartes introduced the concept of two-dimensional graphs with the development of Cartesian geometry. A century later brought another round of innovation, with Joseph Priestley’s creation of timeline charts and William Playfair’s invention of bar graphs, pie charts, and line graphs that represented change through time.
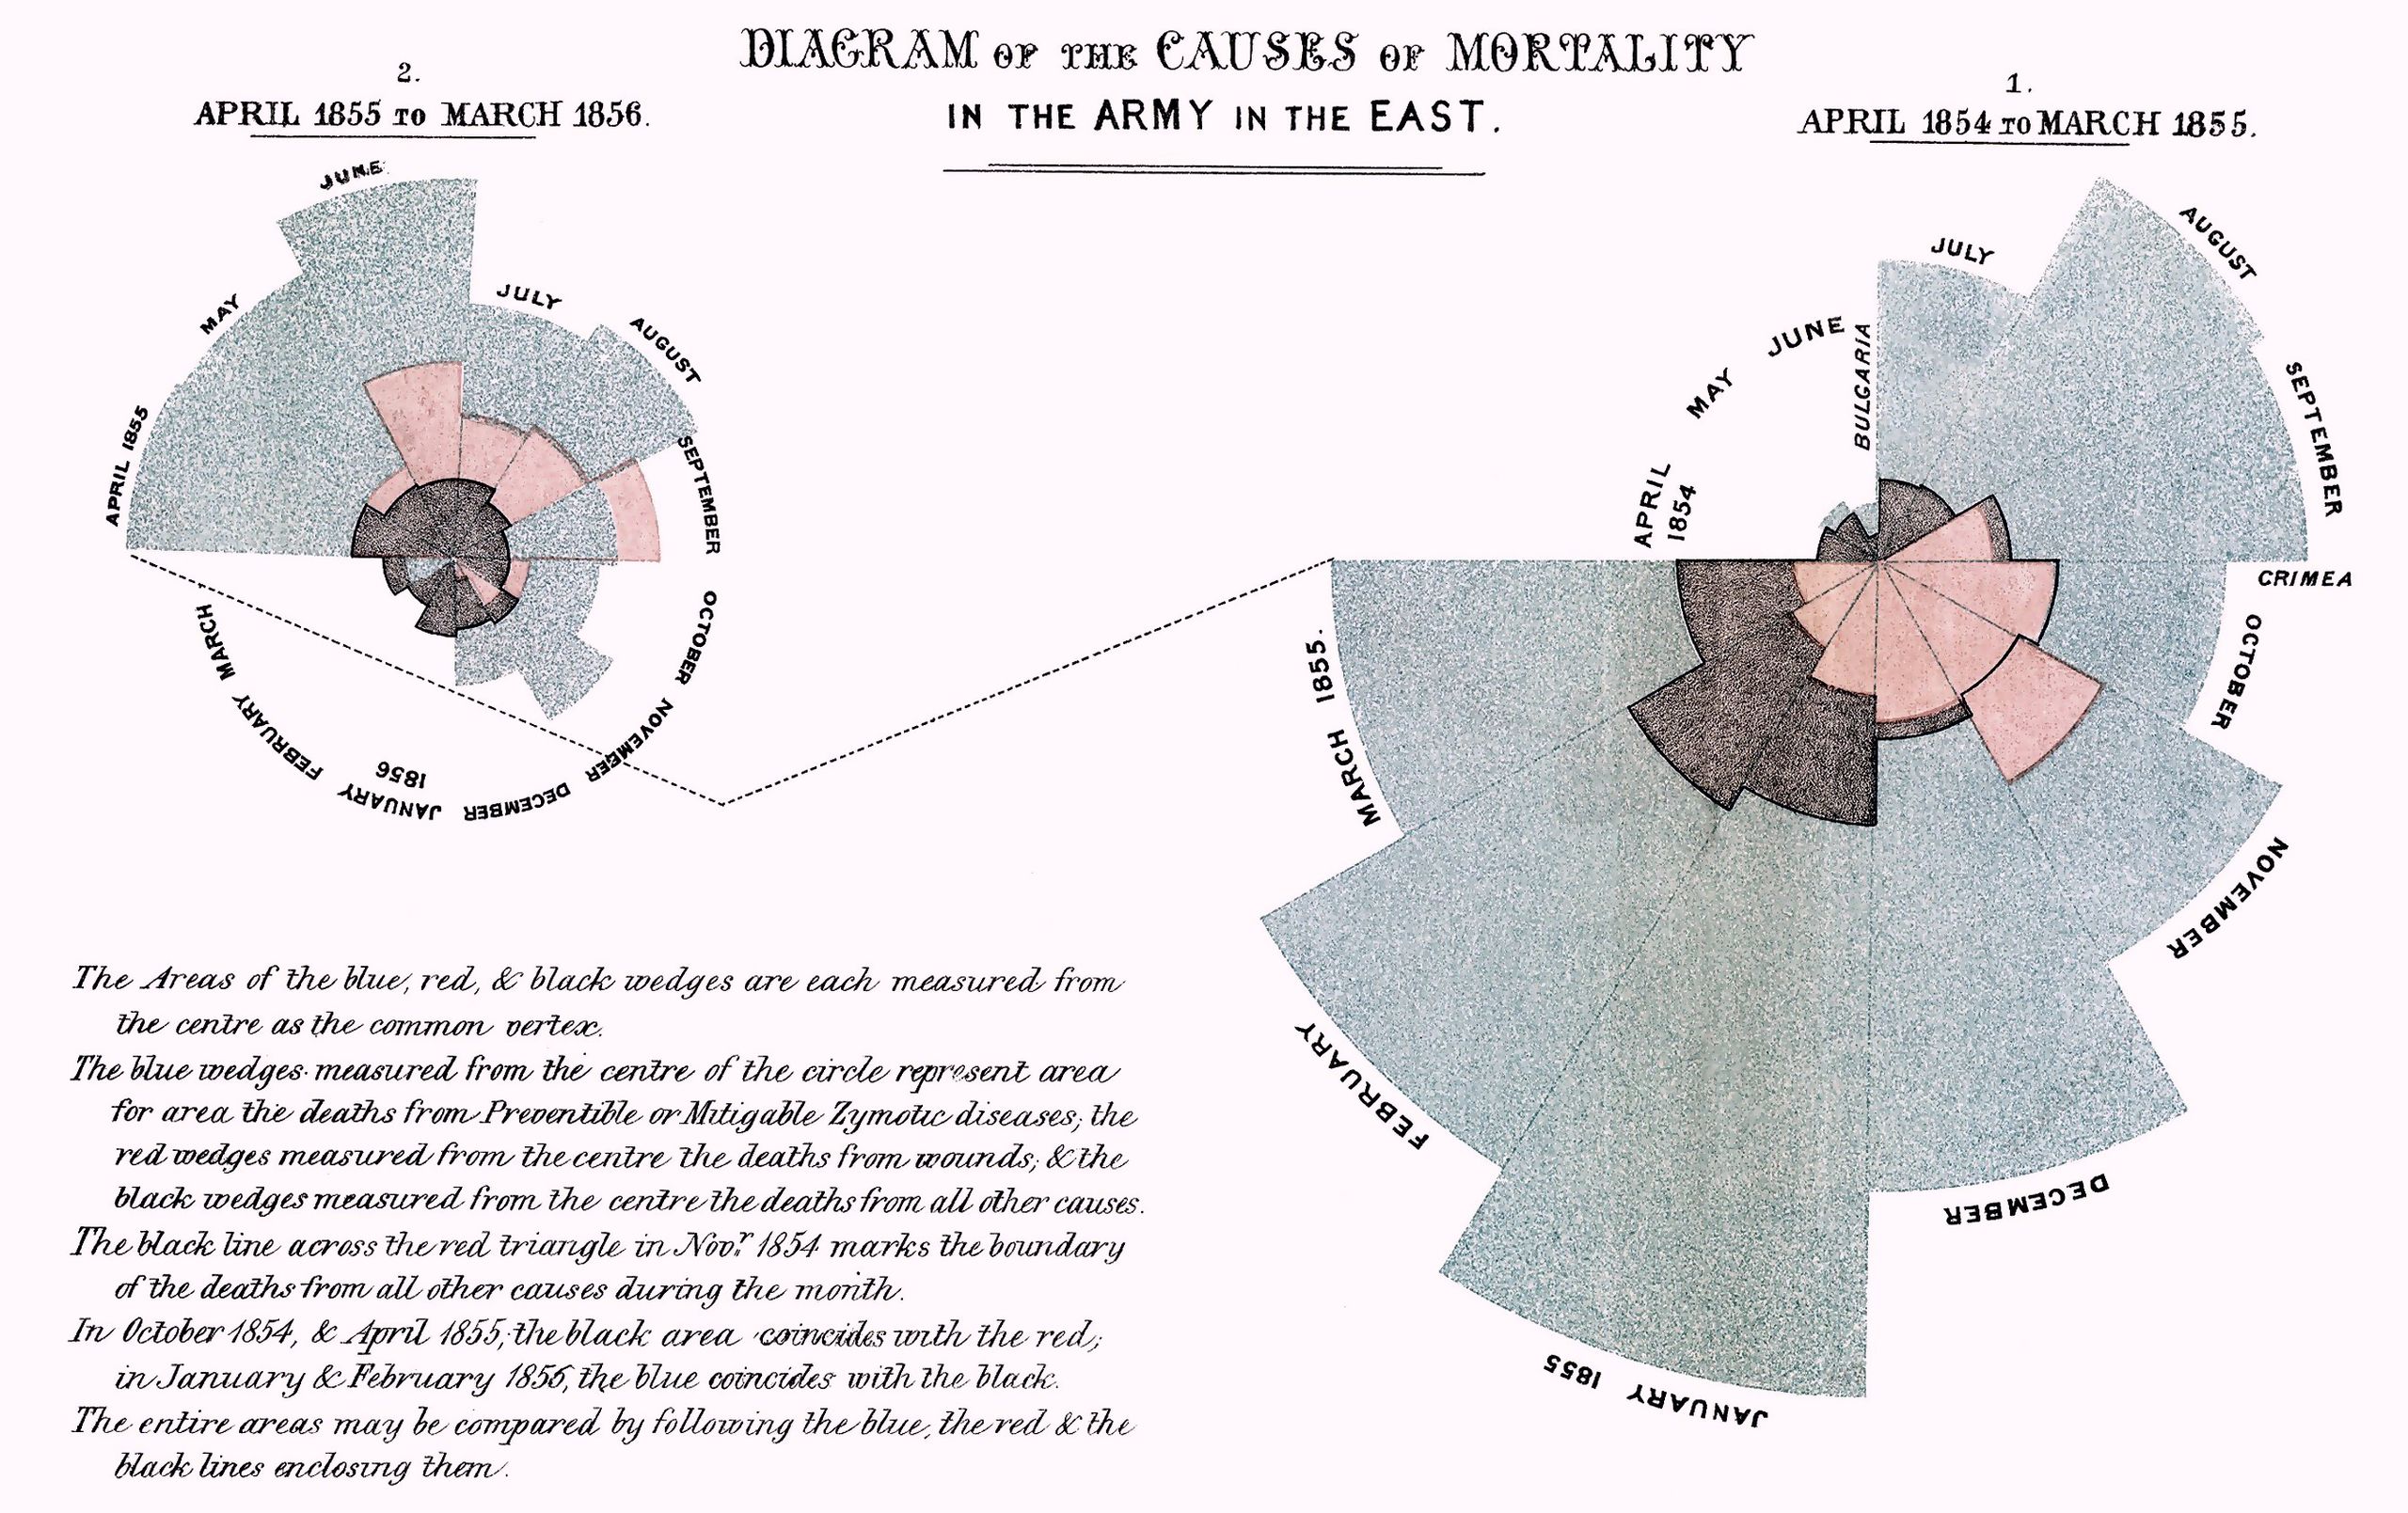
A century after that visualizations had evolved to the point where Florence Nightingale was able to present statistical information about causes of death and Charles Minard created a still lauded chart that managed to convey six pieces of information about Napoleon’s 1812 campaign into Russia in a single graphic.
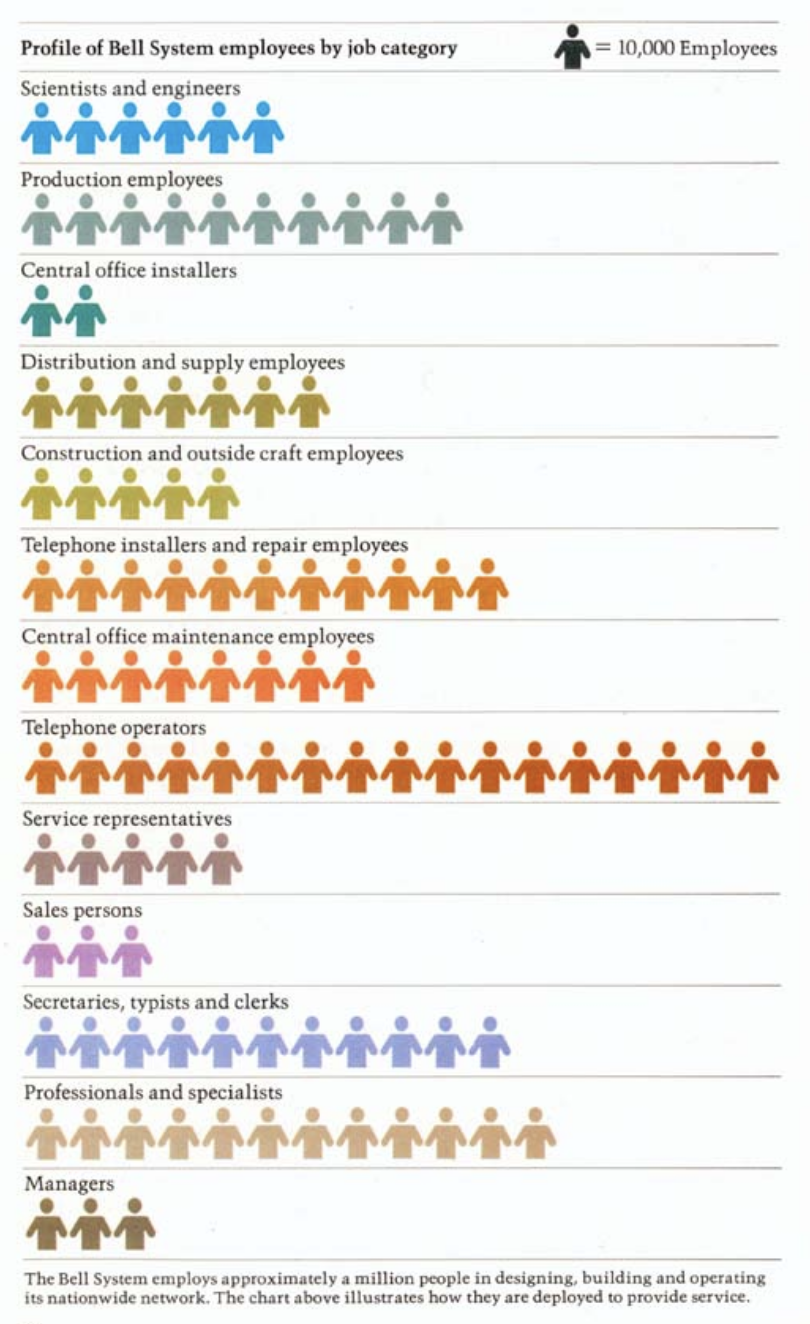
With the passing of another century, charts and graphs became commonplace additions to company reports and news publications (though as this fantastic account from The Economist shows, creating data visualizations before there were robust computer graphic systems was far from a streamlined process.)
The point of all of this is to emphasize that data visualization is not a new discipline. For centuries people have used visualizations to amplify cognition of the underlying data. What’s changed is our ability to do this. In recent years a market of visualization tooling has evolved to help make visualizations less labor-intensive and more reproducible.
An amalgamation of forces in recent years reshaped the business intelligence (BI) market.
- Improved compute performance along with cloud computing has dramatically increased available compute resources. This has made it easier for people to both create and store data.
- There is a growing expanse of both internal and external data available to enterprises.
- The rise of NoSQL databases and machine learning/natural language processing algorithms have made it possible for companies to extract insights from unstructured and semi-structured data.
- Improvements to both software and hardware have made it possible for people to interact with data rather than statically view the data as a dashboard.
- Technology has infiltrated enterprises. It is increasingly expected that every division of the company can and should make data-driven decisions.
Alright, so the story arc so far is that centuries of progress have led to a robust data visualization market. We’re still waiting for that oxymoron shoe to drop from the intro, and if you paid attention to the title that means that at some point you should be expecting me to talk about all the M&A deals that surfaced in the last week in a way that incorporates an Nsync reference. Buckle up.
Tableau and Looker
On June 10, 2019 Salesforce announced their agreement to buy Tableau in a $15.7B all stock deal. On June 6, 2019 Google announced their agreement to purchase Looker for $2.6B.
If those two major deals weren’t enough, Logi Analytics also announced it’s acquiring Zoomdata, and all this follows on the heals of Periscope Data being scooped up by Sisense and Alteryx buying ClearStory Data in the past month. SAP paid $8B cash for Qualtrics earlier this year.
M&A is in the air. Why?
Where Lies the Value?
As the history above demonstrates, there is power in being able to see the data. Visualizations are a crucial tool to helping users track patterns and trends, view relationships between variables, better comprehend scale, understand data distribution, and explore outliers and anomalies. Visualizations are uniquely suited to help inform, persuade, and diagnose in a way that raw data simply cannot.
“With the right representation things become transparent and obvious. With the wrong representation it becomes hard.”
– Vijay Pande, a16z podcast
That said, none of these visualizations are possible without data. Data powers all BI tools. And managing and storing that data is generally not the domain of BI companies.
Initially it seems like a symbiotic relationship: people need data visualized and BI needs data.
However, there are substitutions for any given visualization software. BI software competes not only with other BI tools, but also with homegrown solutions (shoutout to Excel!) and any visualization capabilities built within a major technology vendor’s software.
There are no equivalent substitutions for having access to data.
And thus we have the inherent contradiction of Business Intelligence market: The business intelligence market is neither a standalone market nor can it inherently provide any intelligence to businesses on its own.
This does not mean that the BI market is not important. Clearly it’s multi-billion dollars of important based on recent M&A activity. It’s just that the power dynamic around substitutions does not favor the BI players; it favors the data providers.
And thus to me, the story of all these BI acquisitions is not about the visualizations so much as it’s about the data.
Don’t Really Wanna Make It Tough (for users)
To an enterprise, the existence of data in and of itself is not inherently valuable. The important thing is the enterprise’s ability to use data to drive decisions.
To a technology vendor, data has an inherent value. Once a cloud/SaaS vendor/platform/etc has started to amass data from a customer, the value starts to accrue. Yes, there’s money in the associated compute, storage, and IO, but it goes beyond that. There’s value in the data’s gravity.
Amassing data can lead to churn reduction. Data can lead to higher attach rates or cross-selling opportunities. It can allow vendors to develop more informed products based on telemetry. Sometimes data can be anonymized, aggregated, and packaged as its own product. Data is a valuable commodity for technology companies.
And this is why these tech companies want BI capabilities. Helping users gain value from their own data 1) incentivizes users to keep funneling more data into the platform and 2) disincentivizes switching to another platform. The easier tech companies make it for users to visualize insights, the more data they can aggregate and the more potential points of value and leverage they amass. Technology companies are incentivized to remove as much friction as possible to help enterprises use their data well.
Tech companies can and do build out solutions. One option is creating more seamless integrations between BI products and their own data (an option BI companies like because of the aforementioned need for them to access data.) Tech companies can also try to build homegrown visualization capability within their own products that compete with BI offerings.
But competing in this space is not easy. BI vendors have devoted themselves to building out advanced, user-friendly visualization toolsets. They have niche solutions. They have deeper focus on the domain. They have devoted users. Sometimes these users are more devoted to the BI tool than to the underlying data, which means: BI tools are a potential on-ramp for more data.
Buying a visualization solution isn’t about technology companies expanding into adjacent markets. It’s about entrenching in their existing market.
That, in other words, is why technology vendors

Disclaimer: Google, SAP, and Salesforce are RedMonk clients.
No Comments