
IPO edition! Here are some quick highlights from the recent news about the pending Dropbox and Spotify initial public offerings.
$35.1M
Dropbox’s S-1 reported 2017 losses of $112M on $1.1B in revenue. This marks an improvement in profitability from the $210M in losses in 2016 and $326M in 2015. A large portion of this improvement is attributable to the ‘Infrastructure Optimization’ section of the filing, wherein Dropbox describes “migrating the vast majority of user data stored on the infrastructure of third-party service providers to our own lower cost” as well as purging inactive free accounts.
Amazon is the primary third-party infrastructure provider of note, and much attention has been given to the financially transformative effect of moving away from AWS. Dropbox states that $35.1M of it’s Cost of revenue savings are related to this infrastructure optimization.
My biggest surprise from the Dropbox S-1: How much the company’s finances improved from dropping AWS and building its own infrastructure. https://t.co/QWH8ykiQXa
— Shira Ovide (@ShiraOvide) March 1, 2018
Because it’s me, I had a few accounting questions about this transformation:
Q: After moving off AWS, where did the infrastructure go?
A: “During 2015 and 2016, we migrated the vast majority of user content to our own custom-built infrastructure in co-location facilities that we directly lease and operate.”
Q: Where do I see that shift from cloud to colos in the financial statements?
A: Dropbox considers their infrastructure costs to be a Cost of revenue (that is, an expense that is directly associated with their ability to earn revenue). Now their infrastructure expense in incurred primarily through operating leases rather than payments to a third-party vendor like AWS. For now, both types of infrastructure expense are reflected within the Cost of revenue line item.
Q: “For now?”
A: Starting in 2018, there’s a new FASB rule that requires businesses to show operating leases as commitments on their balance sheets. This won’t have a large impact on Dropbox’s Cost of revenue as you will continue to see payments within the period as operating expenses. However, it will also require companies to show their lease obligations as part of their balance sheet so there is additional transparency around future obligations. For Dropbox, this change is expected to result in “a substantial increase in our non-current assets and liabilities recorded on the consolidated balance sheets.”
Dropbox currently has $1.3 billion in non-cancelable future rental payments related to offices and data centers.
-$112M and -€1.2B, respectively
As mentioned above, Dropbox’s 2017 profit was -$112M on $1.1B in revenue. Spotify reported €1.2B in losses on €4.1B (or roughly $1.5B and $5B in USD.)
Seeing these numbers, I was curious how common it is for a company to IPO with negative earnings. The answer is: it happens reasonably often and is growing increasingly more common.
Jay Ritter of University of Florida tracked U.S. IPO statistics from 1980 to 2015. The below chart uses his data and indicates that over the past four decades there is clearly a growing prevalence for companies to IPO with negative earnings.
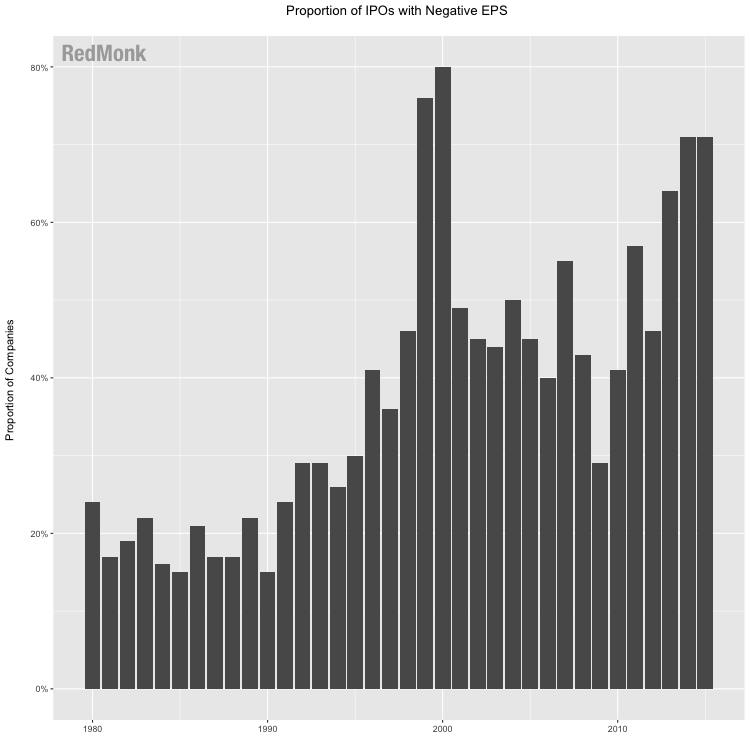
Data source: Jay Ritter, Initial Public Offerings: Updated Statistics
Over the entire period, 38% of IPOs occurred with negative earnings on average. However, if the statistic is isolated to the most recent five years of data (2011-2015), that average jumps to almost 62%.
10-ish
Dropbox and Spotify are each about a decade old. Dropbox was founded in 2007 and Spotify in 2008. Again, I was curious how this fared with other IPOs.
Jay Ritter is apparently the person to see if you want IPO statistics. Here’s yet another dataset wherein he’s tracked the median age of a company when it goes public.
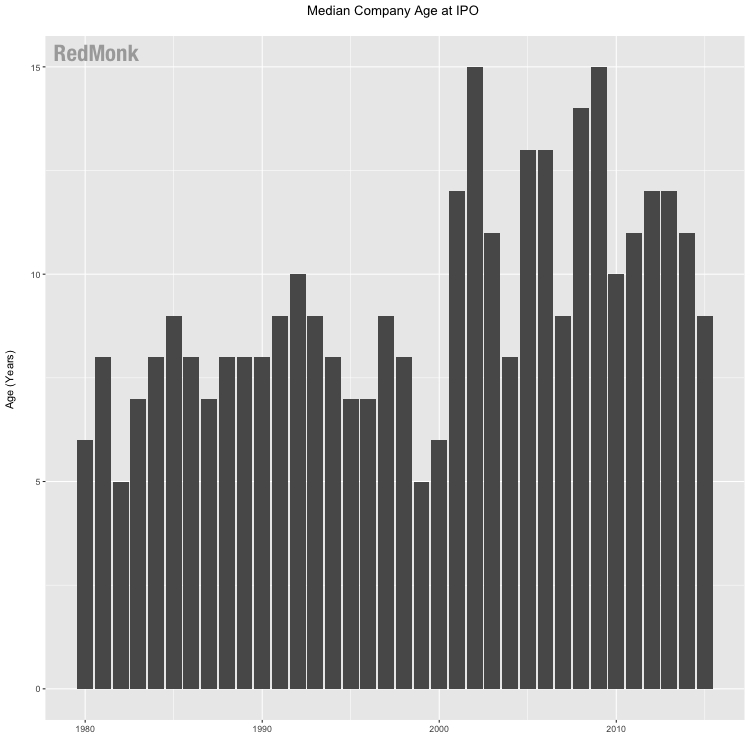
Data source: Jay Ritter, Initial Public Offerings: Median Age of IPOs Through 2015
The trend shows an increase in age for companies that IPO. The average age of a company at its IPO over the full period is 9.3 years, whereas in the last five available years companies have an average age of 11.
Part of this change reflects a change in private financing rules, wherein the increase in the allowable number of investors in a private company has lead to a corresponding increase in available private capital. McKinsey estimates that following this change in regulation, “the capital invested in private companies almost tripled, to about $75 billion in 2015, from around $26 billion in 2013.”
Disclosure: AWS is a RedMonk client.
No Comments