If you care about measuring software delivery effectiveness, then you’ve heard about ‘the DORA metrics.’ But if you haven’t been paying close attention for the last two years, your understanding of this report is outdated. It’s time to update your priors.
The mental model you’re probably using is that there are a handful of core metrics that can help measure a software team’s effectiveness (you’re probably thinking of four metrics, but now there are five.) You’ve probably heard the core tenet that velocity enables stability; elite teams deploy more and low performers deploy less. Meanwhile someone on your leadership team is almost certainly benchmarking you on it even though the people behind the report have always insisted that’s not how the data is supposed to be used.
The report still focuses on throughput and stability, but the underlying metrics have been amended and regrouped. There are no more low – medium – high – elite performers clusters; these have been replaced by something called ‘archetypes.’ The report is highly focused on AI’s impact on software delivery.
The DORA report is trying to capture changes in how we are building software, but the changes are not always easy to grok.
For over a decade this research has served as a key industry reference point for helping teams better measure and improve their software delivery processes. That’s why it’s important to understand the changes.
So let’s delineate how we got to where we are now, and what it means.
The name changed
DORA initially stood for ‘DevOps Research and Assessment’ and the team behind the research put out an annual report called ‘The State of DevOps Report.’ (Over the years the team behind the report has been housed by Puppet Labs, an independent research group, and today Google, which acquired the assets in 2018.)
As of 2025 the report is no longer called ‘The State of DevOps Report’ and is now called:
The State of AI-assisted Software Development
This is not a cosmetic change. It is a change of scope for the entire report.
The before times: how DORA worked
The industry has long treated DORA results as benchmarks. That was always a mistake.
DORA uses cluster analysis, not fixed performance thresholds.
This means teams weren’t ranked against static definitions of what it meant to be ‘elite.’ Instead the clusters were determined each year based on what metrics load together. The service levels associated with each tier (low / medium / high / elite) changed year to year.
Many organizations took a descriptive model and treated it as a prescriptive scorecard, but DORA was never intended to be a ruler against which to gauge general performance. It was intended to be a pattern detector.
This distinction matters, because understanding the way DORA worked historically is important for contextualizing the recent changes.
2024 metric shakeup
Historically, DORA split metrics into two categories:
Throughput
- Lead Time for Changes
- Deployment Frequency
Stability
- Time to Restore
- Change Failure Rate
The problem was that Change Failure Rate consistently behaved like an outlier and didn’t load cleanly with the other metrics.
So in 2024, DORA made a methodological adjustment:
- Time to Restore moved from stability to throughput
- Rework Rate was introduced as a stability metric
Rework Rate is about the number of unplanned deployments caused by production issues compared to total deployments. Change Failure Rate compares failed deployments to total deployments. You would typically expect more unplanned deployments than outright failed deployments, which makes Rework Rate a secondary proxy for measuring instability in systems.
This metric shift was small potatoes compared to what the report introduced in 2025.
2025: from performance tiers to archetypes
In 2025, the DORA report moved away from low / medium / high / elite clusters entirely.
Now the report introduces seven archetypes, based on eight measures:
- Throughput
- Stability
- Team performance
- Product performance
- Individual effectiveness
- Time spent on valuable work
- Friction
- Burnout
Instead of performance tiers, we now get labels like “The Legacy Bottleneck” and “The Harmonious High Achiever,” among others.
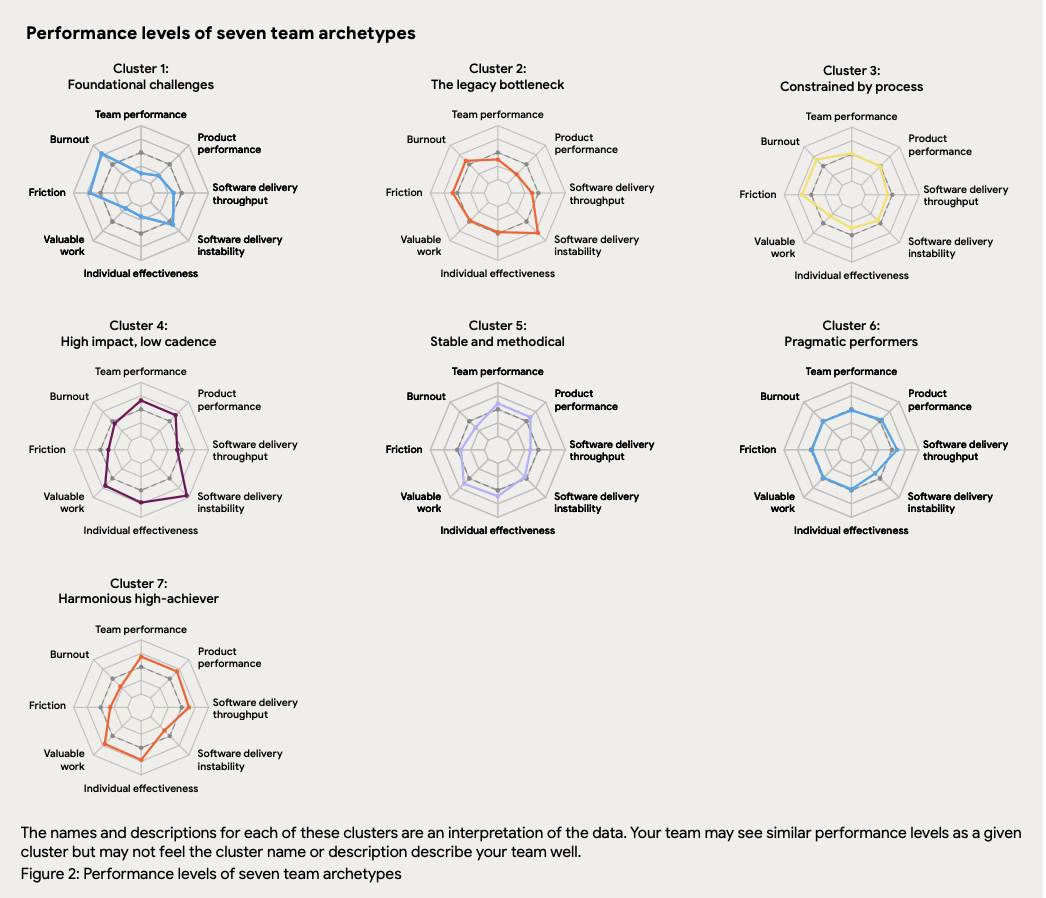
- Image courtesy of the 2025 DORA State of AI-assisted Software Development Report
Using broader measures of team performance is undeniably an attempt at creating a more holistic view of what it means to ship software.
It’s also squishy. It’s harder to measure and implement within an enterprise, despite the recent launch of the interactive AI capabilities model. The spider charts are harder to create and make it difficult to track changes over time. In all, it’s easier to misinterpret. (It will also be very interesting to see what cluster labels emerge next year, given that clusters are not constant year-to-year.)
AI 2024 to 2025
2024 was the first year that AI was formally studied in the DORA report. The results were somewhat paradoxical.
“Roughly 75% of people report using AI as part of their jobs and report that AI makes them more productive.
And yet, in this same survey we get these findings showing that AI has a negative impact on throughput, stability, and time spent on valuable work.”
But it’s only a paradox if you assume individual productivity automatically improves system performance.
So if the majority of individuals are reporting using AI and say that AI makes them individually more productive, but the holistic statistics are showing that use of AI decreases system stability, throughput, and the amount of valuable work an individual is doing, my hypothesis is that we’ve collectively identified and elevated the wrong constraint.
In 2025, 90% of respondents reported using AI within their job function, and users reported using AI tools for a median of 2 hours per day.
Usage increased. Also over the year, AI’s relationship with throughput shifted from negative to positive, and its relationship to time spent doing valuable work also reversed.
Unfortunately, AI’s correlation with increased instability remains.
“Yet our data shows AI adoption not only fails to fix instability, it is currently associated with increasing instability.”
- 2025 DORA State of AI-assisted Software Development Report
And furthermore, they state:
We estimate that between two people who share the same traits, environment, and processes, the person with higher AI adoption will report:
– Higher levels of individual effectiveness
– Higher levels of software delivery instability
– Higher levels of organizational performance
– A higher percentage of time doing valuable work
– Higher levels of code quality
– Higher levels of product performance
– Higher levels of software delivery throughput
– Higher levels of team performance
– Similar levels of burnout
– Similar levels of friction- 2025 DORA State of AI-assisted Software Development Report
In other words, AI improves outcomes at nearly every level except system stability.
Competition, with its own legacy and with the market
DORA changed its measures and clustering methodology in 2025, but it remains to be seen whether the industry is willing to update its understanding of ‘the DORA metrics’ to reflect the report’s new approach.
Throughput and stability are a relatively consistent set of measurable metrics. But how is the average organization going to consistently measure friction? Burnout? Valuable work? The DORA results are based on a survey; is any employee going to report to their employer with honesty that their individual effectiveness is lagging? Can developers even accurately report on product effectiveness and team effectiveness from their vantage point?
These concepts are so subjective. They’d be incredibly difficult to measure with any degree of accuracy and consistency. And consistency is important; metrics become more valuable over time, but that means measuring the same things over time.
While this revamped DORA report is an attempt at a more holistic view of team performance, the introduction of new archetypes and measures will be hard for any organization to successfully implement on their own.
In addition to these changes working against a decade of shared understanding of what ‘DORA metrics’ means to most people, there is a possibility that instead of trying to shift their measurement process to match the new process, organizations will look elsewhere for guidance. There are other competitors vying for mindshare in the market of helping organizations measure software delivery effectiveness. Atlassian recently announced its acquisition of the Developer Experience (DX) Company, and LinearB continues to push into this area. There is no shortage of consulting companies willing to sell enterprises their services.
DORA largely created this market, but it’s presently unclear whether the market is willing to move with them.
Conclusion
Dr. Nicole Forsgren – one of the early authors of the DORA report – states, “we need new frameworks for measuring DevEx in the age of AI.”

I don’t disagree. But I’m not convinced the industry has yet figured out how to implement such a framework in practice.
What made DORA so widespread was the ease in which people could measure their own performance and then track improvement longitudinally. Any replacement framework needs to offer organizations this capability.
Furthermore, the primary concern at present is less about finding a holistic measurement and more about managing the metric we currently have that remains negatively impacted by AI: stability.
As AI increased individual productivity and throughput, it also exposed a persistent weakness across both 2024 and 2025: instability.
We may in fact need a new framework, but in the meantime having a focus on building systems that can be restored to a known good state when something goes wrong is more critical than ever. As I posited in last year’s analysis of the report, these findings primarily reveal that stability, not speed, remains the defining metric of software delivery success.
Related research:
- DORA Report 2024 – A Look at Throughput and Stability, Rachel Stephens
- AI’s Impact on Developer Productivity Vs. Development Productivity, Rachel Stephens podcast appearance on Day Two DevOps
Disclosure: Google and Atlassian are RedMonk clients.
No Comments