Google recently released the 2024 Accelerate State of DevOps (DORA) report, and there were some holy shit moments in those 120 pages. Or–to phrase it more professionally–this year’s report has some very interesting and counterintuitive findings.
In particular this year the report rethinks some fundamental aspects of throughput and stability–time to restore is now being reconsidered as a measurement of throughput and rework rate is being added as a factor of stability. The report also makes it clear that while AI-enabled software delivery is here, its impacts on the system at large are mixed.
In regards to AI in particular, as some of these metrics contradict the industry narrative about the technology, I revisit the theory of constraints and hypothesize that writing code isn’t the bottleneck to deploying reliable applications.
Let’s dive in.
Quick background on the report methodology
The DORA report is created by surveying tens of thousands of technology professionals and aggregating the ensuing data, with the goal of determining if there are practices that are predictive of engineering excellence. The report is in its 10th year, originally conducted as part of Puppet Labs and then operating independently before being bought by Google in 2018.
For our discussion below, there is one element that is crucial to understanding the report’s methodology: this is a cluster analysis. (Don’t panic if you forgot statistics class; more below)
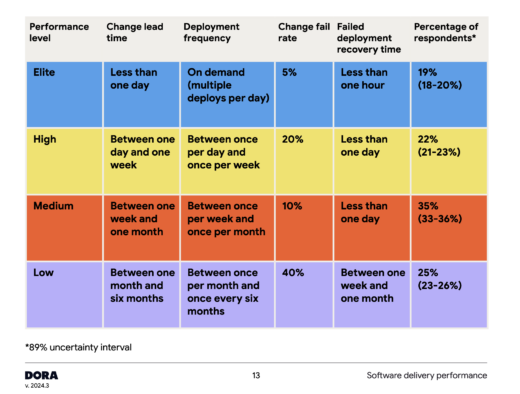
If you’ve seen anything from a DORA report, it is probably the table that describes how tiers of organizations perform across four key operational metrics. Here’s the one from 2024:
It’s important to understand that these values are not pre-defined benchmarks. The performance levels that a team needs to achieve to be placed in a specific low-medium-high-elite group can and do change year-to-year based on survey responses. The metrics by group are not static and change every year.
This variation year-to-year is because the low-medium-high-elite groupings are formed via cluster analysis, a process the 2024 report describes as “a statistical method that identifies responses that are similar to one another but distinct from other groups of responses.”
“This technique has no understanding of the semantics of responses–in other words, it doesn’t know what counts as a ‘good’ or ‘bad’ response for any of the measures.”
– Accelerate, Nicole Forsgren, Jez Humble, Gene Kim
This means the behaviors that define a given group can shift, and based on the fact that there was no elite tier in 2022, even the number of clusters that emerge is not pre-defined. The groupings define the metrics each year.
When the DORA team is analyzing clusters, they are looking for response groupings where the metrics “load together,” or in other words they want high covariance between change lead time, deployment frequency, change fail rate, and failed deployment recovery time (formerly called MTTR, or mean time to recovery) within each cluster.
Throughput and Stability
Over the past ten years, one of the primary messages of the DORA report is that increased throughput correlates with increased stability. This is perhaps counterintuitive, especially in the early years of the report when the industry was still emerging from a “move fast and break things” ethos. By showing that organizations could develop software more quickly while increasing their stability, the DORA report gave organizations an aspirational path to better software performance.
Here’s how throughput and stability were defined and discussed in 2019:
“The first four metrics that capture the effectiveness of the development and delivery process can be summarized in terms of throughput and stability. We measure the throughput of the software delivery process using lead time of code changes from check-in to release along with deployment frequency. Stability is measured using time to restore— the time it takes from detecting a user-impacting incident to having it remediated— and change fail rate, a measure of the quality of the release process.
Many professionals approach these metrics as representing a set of trade-offs, believing that increasing throughput will negatively impact the reliability of the software delivery process and the availability of services. For six years in a row, however, our research has consistently shown that speed and stability are outcomes that enable each other.”
The consistent message of the DORA report has been that organizations do not need to make tradeoffs between throughput and stability.
That is still true in the aggregate, but this year the report identifies a cohort where the correlation between improved stability and increased throughput does not hold.
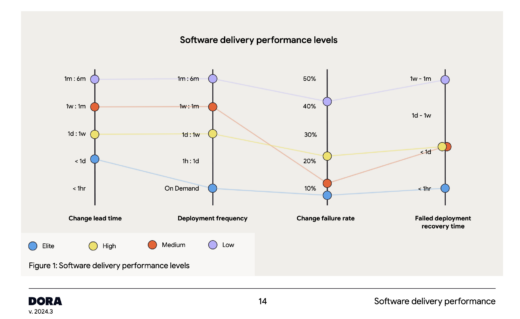
Look at the change failure rate for the medium performance group in the chart below. It’s lower than the change failure rate for the high performance group.
Somewhat confusingly, the report authors note that the correlation still persists:
“Within all four clusters, throughput and stability are correlated. This correlation persists even in the medium performance cluster (orange), where throughput is lower and stability is higher than in the high performance cluster (yellow).”
When I followed up with Nathen Harvey, he clarified that this means the correlation still holds within the cluster (meaning the metrics within each cluster load together), but the results between the clusters are unexpected.
This is an anomaly, but it’s not an entirely new phenomenon. It also happened in 2016, when medium performers had worse change fail rates than low performers.
Redefining Throughput and Stability
Even in years when all the correlations across cohorts behave as expected, the change failure rate metric has a history of not loading as well as the other metrics. Per the 2024 report:
“The analysis of the four key metrics has long had an outlier: change failure rate.”
The DORA team has offered various hypotheses about possible confounding variables over the years. This year they tried to explore change fail rate as a proxy for rework rate, asking users: “For the primary application of service you work on, approximately how many deployments in the last six months were not planned but were performed to address a user-facing bug in the application?”
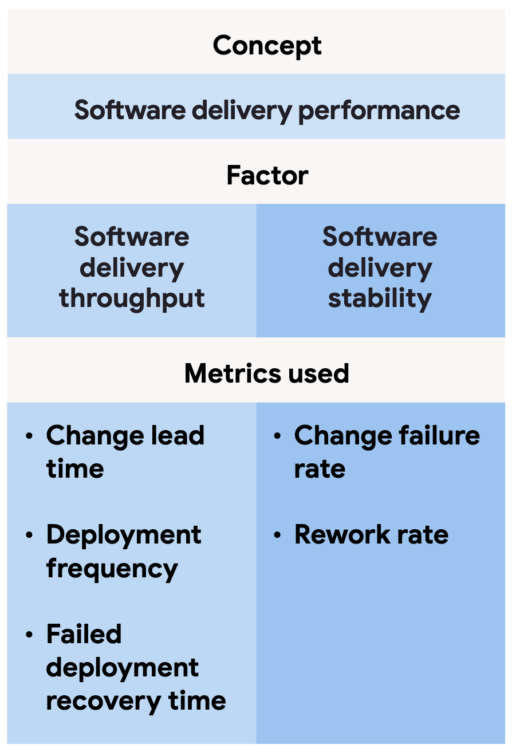
This question about rework was highly correlated with change fail rate. As such the team has considered shifting the report’s stability and throughput factors accordingly:
This means that as of the 2024 report, the DORA team has started defining the time to recover from failure as a measure of throughput rather than as a measure of stability.
AI Impacts on Throughput and Stability
While the 2023 report touched on AI, this year the team was able to delve in more fully.
The survey found that 75.9% of respondents (of roughly 3,000* people surveyed) are relying on AI for at least part of their job responsibilities, with code writing, summarizing information, code explanation, code optimization, and documentation taking the top five types of tasks that rely on AI assistance. Furthermore, 75% of respondents reported productivity gains from using AI.
With those data points, the report’s conclusion that “findings on the adoption of AI suggest a growing awareness that AI is no longer ‘on the horizon,’ but has fully arrived and is, quite likely, here to stay” feels reasonable.
But there is a second level of slightly confusing statistical findings.
As we just discussed in the above findings, roughly 75% of people report using AI as part of their jobs and report that AI makes them more productive.
And yet, in this same survey we get these findings:
- if AI adoption increases by 25%, time spent doing valuable work is estimated to decrease 2.6%
- if AI adoption increases by 25%, estimated throughput delivery is expected to decrease by 1.5%
- if AI adoption increases by 25%, estimated delivery stability is expected to decrease by 7.2%
This report is showing that AI has a negative impact on throughput, stability, and time spent on valuable work.
That’s a bit of a WTF, right? I think the idea of stability decreasing is less surprising; putting systems into production, particularly created with non-deterministic tools, was always likely to create systemic overheads. However, that individuals feel more productive with AI while also spending less time doing valuable work while the system has less throughput feels quite contradictory.
Vendors have promised that AI can reduce toil and repetitive tasks. That it can speed time from ideation to actualization. That it can help us ask questions of our code and systems in natural language, make the barrier to understanding lower for everyone. These findings are seemingly a wrinkle in that narrative.
Just as we should not take vendor marketing materials at face value, these metrics also come with their own set of questions. We’re still at a stage where this technology (and thus the impacts of this technology) have more questions than answers.
What’s going on?
The report offers a few hypotheses here, but I’d like to close out by offering one of my own.
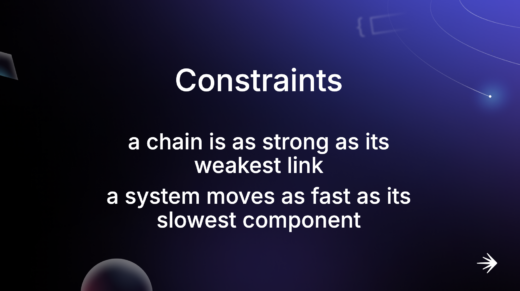
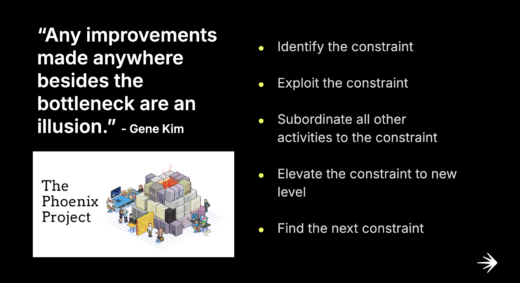
Earlier this year I gave a talk at LaunchDarkly Galaxy about developer experience in relation to constraints in the SDLC. I’m going to drop in three of my slides and then we’re going to talk about it.
High level summary: the theory of constraints requires a holistic, global view of how your processes feed one another. The way you elevate the throughput of your system is finding where you are bottlenecked, maximize the constrained resource to the fullest, and let the constraint drive throughput of the system. You can then add more resources / remove barriers / etc to lessen the strain on the bottleneck. And then you start all over.
As Gene Kim says in The Phoenix Project, “Any improvements made anywhere besides the bottleneck are an illusion.”
So if the majority of individuals are reporting using AI and say that AI makes them individually more productive, but the holistic statistics are showing that use of AI decreases system stability, throughput, and the amount of valuable work an individual is doing, my hypothesis is that we’ve collectively identified and elevated the wrong constraint.
Thus far most enterprise-grade AI in the SDLC has come in the form of coding assistants. These statistics seem to be saying that code generation is not the bottleneck. We can make individuals more productive at creating more code, but that is not the same as making our entire SDLC more effective and more stable.
The RedMonk team are not AI doomsayers. We’ve published a lot of research on the topic, including recent pieces like things developers want from their code assistants, the intersection of AI and open source, AI and the future of search, AI conundrums, and coverage of vendor AI events. We think AI is a seismic shift that will have broad and far-reaching impacts across our industry.
But I think thus far a lot of the industry metrics around AI have been focused on individuals rather than holistic systems. I think what the DORA report is showing is that a x% code acceptance rate might be a great way to see how developers benefit from AI, but an individual developer or even a team of developers going faster does not necessarily make the system move faster. Our systems interact in complex ways.
This is the first iteration of the technology. AI will improve. Solutions will emerge for other components of the SDLC. We thought the bottleneck was developers writing code, but in fact the bottleneck is putting good code into production. After a decade of shifting left and moving things closer to the developer, maybe with AI it’s time to start thinking about how to shift this technology right, or at least asking more seriously how the remainder of the SDLC can adapt to this change in development practices.
* Correction: This piece originally said 39,000 people were surveyed. This number is aggregate for all the years surveyed. The 2023 report said 36,000, implying that roughly 3,000 people were surveyed this year.
Disclaimer: Google and LaunchDarkly are RedMonk clients

No Comments