In 2015, Google restructured into the holding company Alphabet. The overhaul was designed to give investors more clarity around the company’s investments, with the specific intention to break out the so-called ‘moon shots’ from day-to-day operations.
The company has since received increased scrutiny over how various projects contribute to Google’s income statement; this cover of Bloomberg Businessweek is a prime example of the skepticism the company’s facing. ¯\_(ツ)_/¯ However, it was Tim Bray’s post on divesting his Google shares that drew RedMonk’s attention. Our last update on Google’s revenue sources was completed in early 2014, and we were interested to see how things have evolved in the intervening years.
Alphabet’s Revenue by Segment
Because of their respective size and audacity, the ‘Advertising’ and ‘Other Bets’ segments tend to drive people’s perception of the company. As Fortune puts it, “under Alphabet, there is a wildly profitable advertising business, and there is a money-losing unit called ‘Other Bets.’” Similarly, Bloomberg cites an unnamed former executive who says, “no one wants to face the reality that this is an advertising company with a bunch of hobbies.”
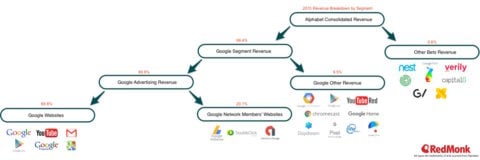
Alphabet’s bread and butter is undoubtedly advertising. In the last full fiscal year, 90% of the company’s top line was generated from advertising, and the majority of this was via ads directly on Google properties. In FY15, 78% of advertising revenue came from Google sites while the remainder flowed through their ad network. In dollars, this equates to $52,357,000,000 in net revenue just from advertising revenue just on Google properties. For scale, if Google’s ad revenue from its own sites was a country, it would be the 78th biggest economy in the world in 2015 (right between Azerbaijan and Panama.)
YTD 2016 shows substantially similar patterns, though overall ad sales is slightly down to 89% of total revenue, and the proportion derived from Google sites has climbed to 80%.
On the other hand, thus far the investments in Other Bets have done comparatively little to drive revenue and have had a negative impact on the company’s margin. In 2015, the Google segment drove over 99% of the consolidated revenue and 100% of the profit. This trend holds for YTD 2016. Though there are many projects, most of the Other Bets are “pre-revenue.” The segment’s primary sales drivers are Nest hardware sales, Google Fiber services, and Verily’s biotech licensing/R&D deals.
The Other Other
The problem with this “cash cow and long shots” view of Google is that it discounts a small but growing area of the company: Google Other Revenue. On the face this segment lacks the scale or audacity of the others, but the company has some compelling business lines housed here. Those who want to understand Google’s strategy overlook Google Other Revenue to their detriment. What details can we tease from this “other other”?
Of notable interest to the developer community, this segment houses Google Cloud Platform. Cloud is a focus area for the company, as evidenced by the headcount commentary on Alphabet’s Q3 2016 earnings call: “Consistent with prior quarters, the vast majority of new hires were engineers and product managers to support growth in priority areas such as cloud.” With key hires like Sam Ramji amongst them, it will be interesting to see if GCP can build momentum in open source communities and partnerships in the coming months.
There are also a number of hardware projects housed in Google Other Revenue. Every year my colleague Steve O’Grady does annual predictions about the industry. In 2014 he predicted “Google will move towards being a hardware company.” While he deemed that prediction a miss during that specific calendar year, the successful introduction of the Pixel phone this year definitely lends support to that hypothesis in 2016. Combine the Pixel with Chromecast and the Daydream VR headset and Google is clearly making a push towards hardware in a variety of avenues.
Alphabet CFO Ruth Porat describes the role of the segment well in the Q4 2015 earnings call: “in many ways, some of Alphabet’s biggest moon shots are in Google itself, from driving the next wave of computing through machine learning, capitalizing on the shift to the cloud by enterprises, building platforms like virtual reality and pursuing the opportunities we see with the next billion users in emerging markets…”
Segment Revenue Trends
We’ve established that there are interesting things happening in Google Other Revenue, but is that reflected in the company’s overall financial position?
Yes.
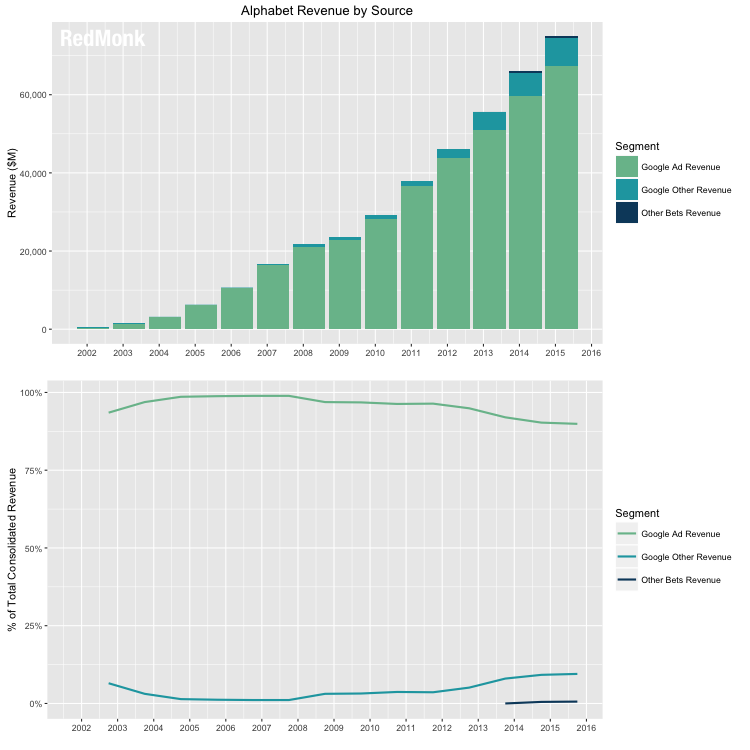
At it’s high point in 2006, 98.9% of the company’s revenue was derived from advertising. This number has been slowly falling in the intervening decade and as of 2015 was at 89.9%. The difference has been picked up by the Google Other Revenue segment. The shift is admittedly gradual, but it does speak to a sustained effort by Alphabet to grow and diversify their revenue streams, with or without a moon shot.
Final Note: Finding Google’s Historic Data
As mentioned, Google restructured to Alphabet in 2015. This adds a layer of convolution to locating their historical financial data, especially once their multiple stock tickers are added to the mix. (After their 2014 stock split the stock began trading under GOOG and GOOGL. The ticker symbols are driven by the same underlying financials, though as an aside GOOGL tends to trade at a small but consistent premium over GOOG because of the share classes; the GOOGL class A shares have voting rights whereas the class C GOOG shares do not.)
If all this post does is save someone the slight inconvenience of navigating that search process, I’ll consider it a win. Here are Alphabet’s ongoing SEC filings as well as Google’s historic filings.


90 % des revenus de Google (Alphabet) proviennent de la publicité – ContactDistance says:
December 19, 2016 at 9:32 am
[…] (RedMonk) […]