One of the interesting things about the software industry is its historical inattention to its byproducts. As 37signals’ Jason Friedman describes, industries from lumber to soybeans have had great success turning the byproducts of their industries into saleable products, into revenue. Most technology businesses today have similar opportunities around their data, but comparatively are leveraging this byproduct in any meaningful way.
A notable exception to this trend has been New Relic, who – for the sake of disclosure – is a RedMonk customer. As far back as April 2009, the team there has been examining data generated by their SaaS application performance management tool to extract Ruby specific insights, one output of which was their “State of the Stack” reports. Examining Ruby traction by version, plugin/gems usage and more, these posts examined trends across the thousands of running nodes monitored by New Relic.
Knowing that we at RedMonk have an interest in developer related datasets and insights, New Relic kindly offered to share with us some anonymized data regarding not just Ruby, but Java, PHP and Python datasets as well. The result is this broader “State of the Stacks” post, which explores some of the same version questions, but also expands the scope to application usage, database preferences and more. What we’re trying to do is comb New Relic’s varied datasets to explore questions important to specific communities, as well as a few broader trends. If there are other areas you’re interested in not covered here, please feel free to suggest them in the comments below.
Reminder
Before proceeding, it’s necessary to state up front that RedMonk is not asserting that New Relic’s data is statistically representative of the market as a whole, or even of the specific communities surveyed. It reflects strictly New Relic users. That said, because the New Relic community represents tens of thousands of nodes monitored which collectively generate billions of transactions daily, we do believe the dataset represents a rare opportunity for direct observation of adoption and usage patterns within one very sizable community. Regarding the Java and PHP data which is being reported here for the first time, as well, New Relic would like to add the following caveat:
This is a partial-yet-statistically relevant sample size from the New Relic customer base, which has 24,000 actively-reporting accounts as of this writing”
In general, then, consider this an interesting look at observational data culled from a very large community, and use caution when attempting to use this research out of context.
Java
Whether they’re writing applications in Java or alternative languages such as Scala, the heart of every Java instance is a Java Virtual Machine (JVM). One of the questions we set out to explore, consequently, was which vendors’ JVM was most popular amongst New Relic customers. Perhaps unsurprisingly, among the JVMs surveyed, Sun’s iteration was by far and away the most popular (89.4%). The third (de facto second) place finish of Apple at 3.2%, however, was a mild surprise, given the server-side nature of New Relic’s offering.

In a post from January of this year, meanwhile, New Relic explored the gains open source Java application servers like Jetty and Tomcat had made at the expense of commercial alternatives like WebLogic or WebSphere. Our analysis of an up to date snapshot confirmed the dominance of the open source Java app servers. Three of the four most popular app servers were open source, with Apache Tomcat more popular than every other application server combined, commercial or open source. Among commercial Java application servers, interestingly, JRun was the most popular. WebSphere, meanwhile, was roughly twice as popular as WebLogic.
There are two ways of looking at this data. The first is that the correlation between New Relic customers and customers of products such as WebLogic or WebSphere is low. The second is that the pattern of adoption within New Relic customers is predictive; that bottom up adoption means the end of procurement as we’ve known it [coverage]. Both are true, but our long term expectations are that the lack of barriers to open source adoption will mean shifts in adoption.
One of the other obvious questions answerable from this dataset concerns operating system usage. Specifically, we looked at the distribution of reporting operating systems (for each dataset, there are some number of nodes that fail to report OS type and version) on a per language basis to see if there were any readily identifiable trends to be extracted.
Within the Java dataset, operating system usage follows relatively predictable patterns, namely heavy Linux usage (82%), with solid Windows traction (12%) with some Mac and SunOS (Solaris) nodes. There is even a single instance of OS/400 reporting, which was interesting.

PHP
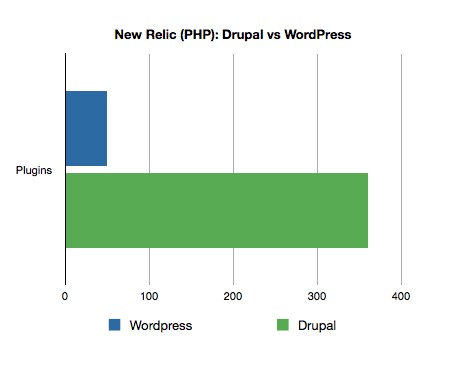
One of the more interesting questions we had regarding New Relic’s PHP data was concerning application popularity. Of the New Relic daemons that reported back application and framework telemetry, almost twenty different specific combinations were mentioned. Ranging from CakePHP to the Zend Framework, the two most popular were – unsurprisingly – Drupal and WordPress. What was interesting was the relative frequency of each. Drupal was 86% more popular than WordPress among reporting applications. There are many potential explanations for this, but the disparity was notable enough to merit a mention.
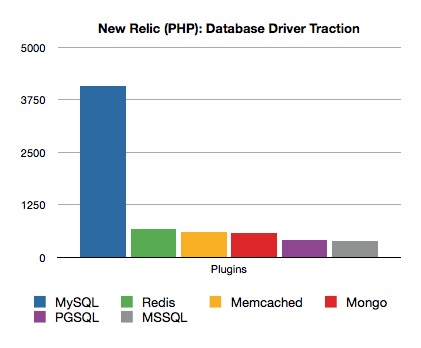
Besides applications, one of the usage metrics we track closely relates to database adoption. For these datasets, this meant identifying and comparing the most popular database driver for each package surveyed; the aggregate totals for all potential drivers may vary slightly. The differences in relative adoption rates from different languages are notable, as we’ll see, but PHP offered relatively few surprises. MySQL was the overwhelming choice, 83% more popular than second place Redis. It was somewhat interesting to see Mongo place lower than both Redis and Memcache, but many Mongo developers never bother with drivers and PHP’s affinity for caching and in-memory data stores has historically been strong. Note PostgreSQL’s finish; this will stand in contrast with its performance in other communities.
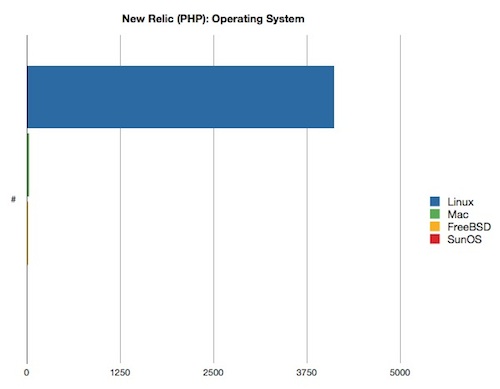
With regard to operating system usage, PHP was the only dataset with no Windows systems visible. The dominance of Linux – 99.7% of all reporting systems – was perhaps to be expected, but the complete absence of Windows in this dataset was nevertheless notable. [Update: according to New Relic, there’s a very logical explanation for this: their PHP agent does not support Windows. So while Linux remains dominant, this dataset does not demonstrate that its success is coming at the expense of Windows.]
Python
Crawls of the Python data yieled little application or library specific data of interest; better than forty plugins, including ConfigParser, base64, httplib, and urlparse tied for first in terms of usage. BeautifulSoup, for anyone interested in the screen scraping package, was 185th down the list.
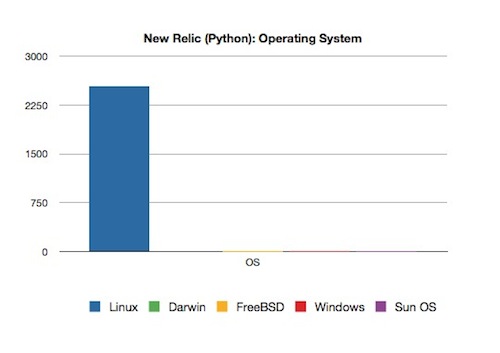
As above, we examined operating system usage. As is the case elsewhere, in the reporting New Relic instances, at least, that platform with the strongest affinity for Python is Linux. Of the nodes running Python, 99% were running Linux. Darwin – representing OS X instances – placed second. Which itself isn’t unusual, but even given New Relic’s server side nature, the absence of non-Linux platforms was notable.
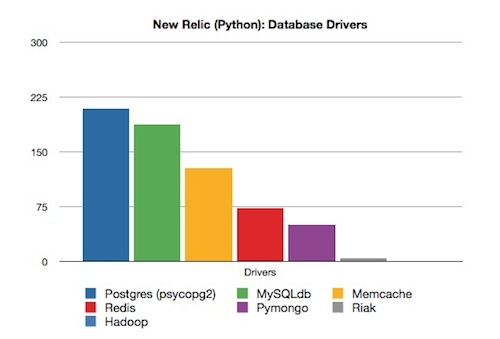
We also looked at the distribution of datastore drivers among Python users. Interestingly, we saw more reported usage of PostgreSQL than MySQL in the Python data. MySQL was a strong second place, finishing 11% behind Postgres and 31% ahead of Memcache, but it is interesting to see PostgreSQL finish ahead of the typically ubiquitous MySQL – though the above caveats apply. As with PHP, Memcache and Redis both placed ahead of Mongo. Riak and Hadoop were present, but showed minimal traction.
Ruby
In the tradition of New Relic’s State of the Stack Ruby editions, we analyzed version usage for both Ruby and Rails. First, here’s a chart of the versions of Ruby in use on New Relic monitored nodes.

Next, here’s a look at the versions of Rails reported by New Relic instances.

Notable in both charts is the split between users. This data suggests that Ruby – or at least Ruby users running New Relic – are two distinct constituencies. One who is conscientious about keeping current, and a second which is more comfortable lagging considerably behind current. The implications for this are multiple; for vendors targeting the Ruby space, it may be worthwhile assessing whether or not your customers trend towards one group, and if so how you might adjust your offerings for them. For service providers, meanwhile, it might be useful to understand the reasons behind the second group’s lag; if they are legitimate technical issues, it could mean that support for multiple backdated runtimes will be a differentiating feature.
One of the common questions about Ruby is regarding frameworks. Rails is the most visible, of course, but the growing popularity of alternative frameworks like Sinatra raises questions about their relative popularity levels. The data showed that while Rails remains substantially more popular (84%), Sinatra is showing robust usage, with the framework visible on nearly two thousand nodes.

We also looked at the distribution of datastore drivers within the Ruby dataset. With the exception of memcache and Riak, usage of each eclipsed the thousand node mark. As with Python, Postgres usage outpaced MySQL adoption, but this time by a more significant margin (39%). The most obvious explanation for this seemed to be partnerships like the one New Relic enjoys with Heroku, a source of thousands of the surveyed Ruby nodes (the data has been anonymized, remember, so there’s no way for us to determine the host for any particular datapoint). New Relic confirmed this, and further states that with Heroku hosts excluded, MySQL is the dominant database platform.
But while it’s easy to dismiss the Postgres performance as an artifact of these commercial relationships, it’s necessary at the same time to consider the role that Heroku and similar platforms may play in database adoption trends. Because PaaS platforms are seeing increased developer interest and traction, they may well have a role to play in wider technology adoption patterns, databases included. The New Relic data indicates that in these scenarios, Postgres may stand to benefit.
Besides the traction of Postgres, the continued visibility and performance of Redis is worth calling out. While it lags MySQL by a significant amount, its sustained traction across differing communities speaks to both its potential and success to date.

Lastly, we examined the operating system distribution within Ruby as we have with the other environments. Presumably as a function in part of its larger sample size, operating system usage within Ruby users showed greater diversity, but remains substantially top heavy. Windows performed best in this environment, but Linux still dominated overall, with 71% of reporting systems and 65% more nodes than second place Windows.

Final Thoughts
Among the takeaways from the New Relic dataset is the progress that Postgres continues to make from an adoption perspective. MySQL remains the dominant platform in most quarters, but the tortoise to MySQL’s hare is showing strength amidst specific development communities. Redis, likewise, was a strong second tier option. Even acknowledging the imperfection of the measurement mechanism, which likely undersold Mongo among other platforms, Redis’ performance was a mild surprise. The fact that VMware is investing in both of these platforms is also worth noting.
Besides data storage preferences, the cental role that Rails continues to play in the Ruby community is apparent. Present on more than half the observed Ruby nodes, the framework that was originally a byproduct of 37signals application development process remains a vibrant project. This bodes well for the various PaaS platforms for whom Rails is a central application focus, even as the data indicates that challenges and/or opportunities may exist within the Rails community with respect to version currency.
Lastly, the New Relic data supports our general contention that fragmentation – driven by broader developer empowerment – is accelerating [coverage]. With individual choice necessarily comes a high volume of individual choices. Awareness of this is evident in the design goals of select projects today; CloudFoundry and OpenShift, for example, have been multiple-runtime oriented since day one. But for vendors that continue pursue single stack strategies, the challenges will be mounting as all of the available evidence indicates that platforms offering choice will be advantaged.
More broadly, the New Relic dataset is an excellent example of the value of aggregated data. The insights contained in observations of thousands of running systems are many, and we’ve barely scratched the surface here. From database preferences by community to the distribution of programming language versions, the data that today is considered a byproduct will tomorrow be informing decision makng processes. Our thanks to New Relic for sharing their data with us; we’ll continue to look for opportunities to tease out interesting and unique insights. Suggestions to that end are, as mentioned, welcome. One obvious area for future exploration is trending within this dataset, or exploring this data in a time series context.

