A growing number of the inquiries we field at RedMonk center around the need for quantitative guidance on technology uptake. Even with technologies on clear growth trajectories, developers, enterprises and vendors alike frequently want better, more detailed data on growth. How fast is it growing? What impact is this having on competitive projects or products? And so on.
Recently, the inquiry volume regarding decentralized or distributed version control technologies such as Git has spiked. Some organizations are considering migrations to such technologies, others have committed to the move but require data to justify their decisions internally.
Interested as we are in developer behaviors and usage trends, we recently examined the question of DVCS usage via Ohloh. Before proceeding, it’s necessary to note that the following analysis does not attempt to claim that Ohloh data is representative of the wider software development market. It is nothing more or less than an attempt to examine one specific dataset, and how it has changed over time. That said, given Ohloh’s focus on open source repositories, the case can be made that its data is likely to be more predictive than other mainstream sources might be.
In November of 2010, Ohloh was tracking 238,000 projects. Of these, the breakdown of code by version control system was as follows (all charts based on Ohloh data).

Notable on this chart are the overwhelming Subversion traction, the surprisingly robust performance of CVS (CVS was 24 years old in 2010) and the lesser but still visible usage of Git.
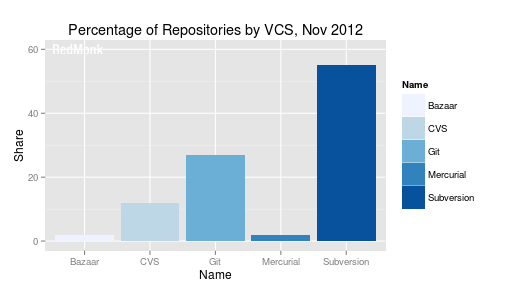
Two years later, a few things have changed. Here is Ohloh’s November 2012 data.

The two most obvious changes are the decline in CVS traction and the growth of Git. Git’s share, in particular, almost tripled in two years, while CVS declined by better than 50%. The fall off in Subversion usage was much less dramatic at -5.3%, but still visibile.
Here are the relative growth/decline numbers for all of the surveyed repostories between 2010 and 2012.

This chart makes two simple points evident. First, that each decentralized repository demonstrated growth while the two centralized systems declined. Second, that Git substantially outperformed both Bazaar and Mercurial from a growth perspective.
As obvious as it may be, however, that decentralized systems are growing and centralized declining, it is equally apparent that there is yet substantial room for growth. Here is the Centralized vs Decentralized split for the 2010 repository numbers.

A full 86% of Ohloh surveyed repositories were centralized in nature two years ago, although the majority of them as described above were at least on the more modern Subversion. The mentioned growth for DVCS projects is evident in the aggregated numbers for November 2012.

Clearly, DVCS – led by Git – has made substantial gains in overall usage. Nearly a third of all projects are now employing DVCS, versus 14% two years ago. And yet almost 70% of projects remain in centralized version control.
How you view this data likely depends on your perspective. Defenders of centralized version control can point to the still subtantial amount of code that is governed by systems like CVS or Subversion. Advocates of DVCS, meanwhile, can point to the growth trajectory of the platform, not to mention highly visible implementation like GitHub, recently valued at three quarters of a billion dollars. However one interprets the data, however, the clear winner over the past two years has been Git. Almost half of the total change over the past two years is Git alone. If you’re looking for bets, then, based on this slice of version control system usage, DVCS generally and Git specifically would be the most obvious.
Disclosure: Black Duck, the parent company of Ohloh, is a RedMonk customer. Black Duck was not consulted concerning this analysis, however.
