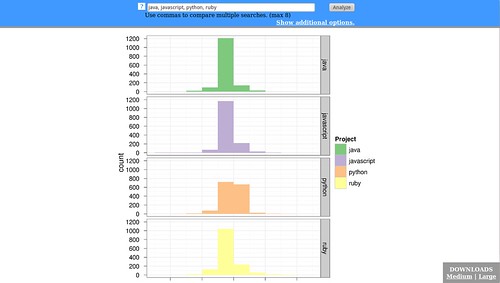
In early July, I ran across Jeffrey Breen’s post on doing sentiment analysis in R a bit before two in the morning. It was interesting enough that I stayed up into the wee hours of the morning digesting his approach, downloading the necessary dependencies in R and outputting very basic sentiment histograms. Since then we’ve included it as a supplement to our research, as in examples like our post on PhoneGap’s marketplace trending.
The approach has its limitations, of course. Breen’s presentation discusses them, as does Nathan Yau when he used the code to compare brand performance for everything from airlines to pizzas. The results can’t be considered representative in a statistical sense, for one, because it’s not technically a random sample. But with the caveats understood, there is evidence that the scoring is good enough to be useful as one of many inputs to decision making processes.
Interesting as this code was, however, it was less than accessible to those without experience using R. Even if you could fully document the process of running an analysis, as I did in internal RedMonk documents, it required a local implementation of R, and more specifically a version that worked with the twitteR library. Which only one of us at RedMonk had.
Given these barriers to entry, we decided to layer a more accessible front end on the back end R script, in this case a web UI. Via Hacker News, we connected with Alex Henning – a college student – and tasked him with building us a simple front end for Breen’s script. He called this Project Blue Bird.
Always intending to open source this code, we needed first to seek the permission of the authors of our two dependencies: Breen’s R sentiment code and the sentiment lexicons (available for download here) it uses that were assembled by Bing Liu and Minqing Hu. Coincidentally – as we’d had no contact with Breen while building Blue Bird – his code was made available on GitHub under the precise license we had intended to use, the Apache 2.0. Which left the sentiment lexicon. Fortunately for us, Professor Liu yesterday graciously gave us permission to include the sentiment lexicon in our repositories. Which means that we are now free to open source Project Blue Bird. On GitHub, obviously. Find it and fork it here.
For those interested in such things, the project was written in Python and uses the low level rpy2 interface to talk to R. Graph output is done via the excellent ggplot2 R package. The README has the complete list of dependencies.
A couple of caveats for those of you interested in using it. The UI is basic. For scheduling reasons, we advantaged function over form. The latency of the application, in addition, is high because the retrieval of matching tweets is slow. We cache what we can, but initial queries are going to take a little bit. And as mentioned above, we caution against reading too much into the sentiment graphs themselves; they’re useful and insightful rather than authoritative.
All of that said, we hope that our community, the R community and anyone interested in general sentiment analysis will find this useful. At RedMonk, we try to give back wherever we can, and if there are developers out there that can use this, that’s a win.
We’d like to thank Alex Henning for his excellent work on the project, Jeffrey Breen for the sentiment analysis code and Bing Liu and Minqing Hu for the lexicon that’s at the heart of this analysis.
Enjoy, and let us know what you think.

