A year ago, a CTO that had landed a large public round and secured a quarter as much in a less public investment candidly described the process saying, “this used to be called going public.” MongoDB, the recent beneficiary of a $150M round led by Intel, Saleforce.com and Sequoia would likely agree. As might Uber, who received $250M in financing from Google Ventures. Going public is clearly no longer the sole route to market for outsized capital requirements.
Which isn’t to imply that venture deal sizes are, on average, increasing. Thanks to a combination of factors from the rise of early stage investment vehicles like Y Combinator to open source software and the public cloud, data gathered by Chris Tacy (below) indicates that if we conflate angel and traditional venture investments, deal volume is up but the size of individual deals is actually in decline.

But at the opposite end of the spectrum, anecdotal evidence suggests that private funding is increasingly competing with public markets in ways not seen previously. The question is whether the data validates the assumption that private companies are being funded on a scale historically competitive with public market returns, and what this means for the wider market moving forward.
To expore the first question, it’s useful to examine data (PDF) on US Initial Public Offerings from 1980-2012 collected by Professor Jay R Ritter of the University of Florida. In his own words, the sample includes “IPOs with an offer price of at least $5.00, excluding ADRs, unit offers, closed-end funds, REITs, partnerships, small best efforts offers, banks and S&Ls, and stocks not listed on CRSP (CRSP includes Amex, NYSE, and NASDAQ stocks).” For example, here is the total number of IPOs per year beginning in 1980.

It should be no surprise to most that public offerings spiked in the late 1990’s. The Tulipmania hysteria that absorbed the technology industry – and eventually, the world – during the bubble has been well documented. What’s interesting about the this chart, however, is that it indicates that the market has yet to recover from the tech-driven crash in public offering volumes. The median number of IPOs per year from 1980 to 2012 is 174. We have not seen that many in a given year since 2004. The recent recession, of course, undoubtedly depressed the appetite for entities to take themselves public. But even in years of relative prosperity, domestically, IPOs seem to have lost some of their luster.
One potential explanation would be the returns. Below is a chart of the aggregate proceeds from all IPOs in a given year as calculated by Ritter. To normalize them for context, however, all numbers have been adjusted for inflation. Dollar amounts depicted, therefore, represent an approximated value in 2013 US dollars.

While the trendlines don’t match precisely, it’s interesting and perhaps not surprising to note the strong correlation between the returns from public offerings and their frequency. It is also worth noting that while proceeds have recovered more strongly than volume, the aggregate returns from public offerings remain depressed. From 1980 to 2012, the median return in 2013 dollars for the aggregate of a year’s worth of public offerings is $28.5B – a figure that hasn’t been reached in four of the last six years. An analysis of the average individual returns, however, challenges the hypothesis that the lack of an expected return is preventing would be IPOs from transacting.
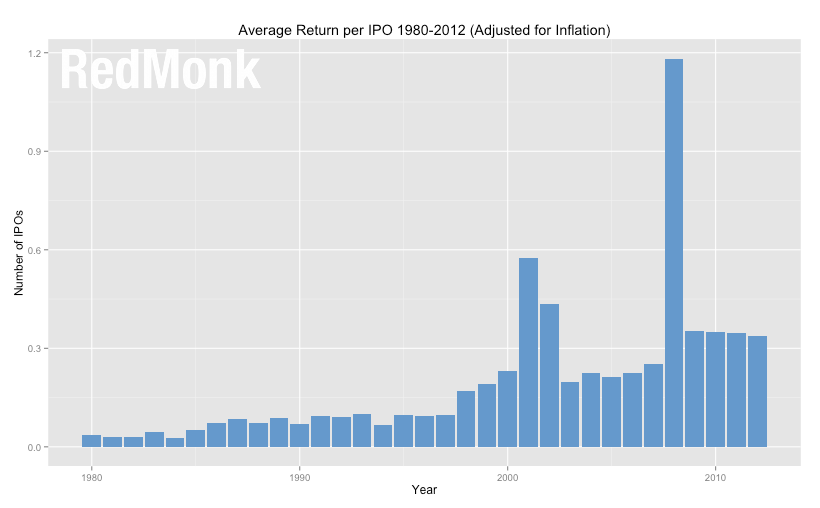
The above chart depicts the aggregate returns for a given year divided by the number of IPOs – providing us with, essentially, an average IPO return. Even after normalizing against a 2013 dollar scale, it’s apparent that the realizable returns per transaction are still growing (if you’re curious about the 2008 outlier, that’s the year VISA went public and raised ~$17B). Which in turn should mean that the incentive to go public remains, and certainly entities from Google (1998) to Facebook (2012) to the aforementioned Twitter have chosen that path in spite of the availablility of capital in private markets.
Still, it is interesting to observe that deals like MongoDB’s $150M round dwarf the expected returns from historical IPOs, even after adjusting for inflation. For example, from 1980 to 1997 the average adjusted return from a public offering never eclipsed $100M. Since then it has dramatically expanded, with the median adjusted return since 1997 weighing in at approximately $253M, or approximately $100M more than MongoDB raised in its last round.
If more companies then are either delaying going public or avoiding the public markets entirely, one would expect to see a rise in venture backed companies eventually going public. While the costs of starting and running businesses have in many respects come down due to dramatic drops in the costs of technical infrastructure among other categories, these have in many respects been offset by spikes in other areas, notably healthcare. Which means that whether public or private, growing companies are likely to still require financing to fuel growth. And indeed, we find exactly this sort of trajectory in venture backed companies.

The above chart depicts percentage of IPOs from technology entities that were backed by venture capital. While the overall percentage has always been high, the trendline is clearly towards greater VC participation. Which makes sense in the wake of a decade of decreased reliance on public market alternatives.
As for what all of this means moving forward, the answers are unclear. In the aggregate, the private market is obviously not lacking for available capital. Just as clearly, decline in volume or no, the returns remain there for public market entrants – or at least some of them. But as the number of large venture deals that approximate the anticipated returns from a public offering appears to be on the rise, it’s worth monitoring the dynamic between public and private funding sources. In the meantime, we’re likely to continue seeing the kinds of deals that “used to mean going public.”

asyncio says:
October 11, 2013 at 3:40 am
One very large reason that the IPO market has not returned to 2004 levels is Sarbanes-Oxley. It raises the burden of going public enough that it creates a significant market distortion and the incentive to seek alternative ways of raising large rounds.
stephen o'grady says:
October 11, 2013 at 4:02 am
Agreed, and that should have been mentioned directly. The burden of running a public company today from a regulatory perspective is such that there are those – e.g. Palantir – who choose to avoid it.
And on the flip side, there are others like a Dell that find the attendant scrutiny problematic as they cope with disruption and retool their existing business.