For the past three years, Stack Overflow has run a survey of its userbase to see what sorts of things they care about in jobs and technologies they use. To my surprise, I couldn’t find anyone who really dug into this data other than Stack Overflow’s own writeup, which wasn’t particularly detailed. Their writeup does do a reasonably good job of breaking down the distributions within individual questions, but it entirely ignores the question of how everything is tied together.
Fortunately, the data from the 2012 survey has already been parsed into Statwing and is available as their demo, which made it convenient to explore. I dug through all of it to pull out all of the statistically significant and meaningful correlations between answers. I then imported that data into the graph visualization tool Gephi to create this (click to enlarge):
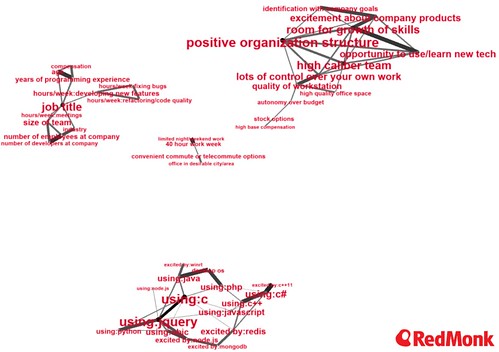
Labels are sized based on how many other features are connected to that particular one (a.k.a. degree), while the line thicknesses are based on the size of the effect between pairs of features. There’s a whole lot to pull out of this graph, so let’s run through it cluster by cluster.
Top-left cluster: How developers spend their days. This breaks down the correlations between companies, time at work, and job experience. One thing we can see here is that as team size grows, the time spent in meetings to coordinate a larger team grows with it. Another is an interesting correlation suggesting that most developers aren’t dedicated purely to features vs bugs vs refactoring. Rather the time spent on each is rather strongly correlated with the others, so more time on features also means more time fixing bugs in those features, etc.
Middle cluster: Work-life balance. This is the population of 9-to-5 developers. They want to work 40 hours, avoid nights or weekends, live close to work, and live somewhere nice. They make up 45–50% of survey respondents (who called these factors very important or non-negotiable).
Top-right cluster: What good companies look like. Interestingly, this cluster has a very high interconnectedness, showing how important many of these factors are, not just a few. It’s clear from looking at this cluster for even a moment that good jobs are much more about engagement than salary. They’re about working with top-notch people in teams with opportunities to grow and work on things that matter.
Bottom cluster: What technologies get used by the same developers. Some of the strongest correlations here were actually between OS and languages — PHP developers are very biased toward OS X, while Java developers are very biased toward Windows. Weirdly, C# did not show a strong OS bias. There was also a very strong overlap between C++ and C#, presumably another indication of the Windows-based development ecosystem. Some of the particularly interesting and strong effects in actual use (not just excitement) were jQuery and Python (0.385 on a 0–1 scale) and jQuery and C (0.334). What I found most interesting about the technologies is this — one of the strongest effects is between those two wildly disparate technologies.
There’s a lot more data to be pulled out of these surveys; this is just a taste. Head over to Statwing and try it out; if you learn anything, post it in the comments.
Disclosure: Statwing and Stack Exchange are not clients.


No Comments